
|
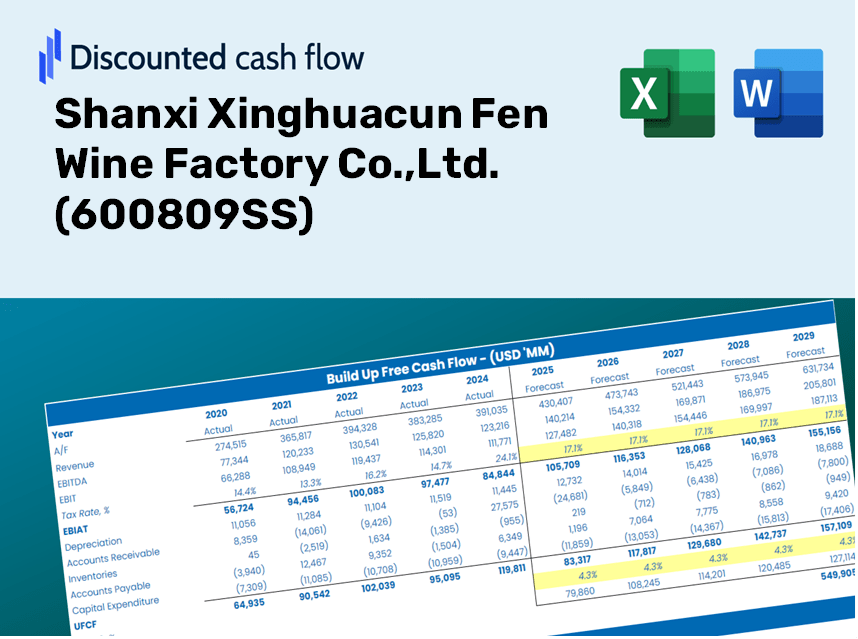
Shanxi Xinghuacun Fen Wine Factory Co., Ltd. (600809.ss) Valoración de DCF |
Completamente Editable: Adáptelo A Sus Necesidades En Excel O Sheets
Diseño Profesional: Plantillas Confiables Y Estándares De La Industria
Predeterminadas Para Un Uso Rápido Y Eficiente
Compatible con MAC / PC, completamente desbloqueado
No Se Necesita Experiencia; Fáciles De Seguir
Shanxi Xinghuacun Fen Wine Factory Co.,Ltd. (600809.SS) Bundle
¡Optimice su tiempo y aumente la precisión con nuestra calculadora DCF (600809SS)! Utilizando datos auténticos de Shanxi Xinghuacun Fen Wine Factory Co., Ltd. y suposiciones personalizables, esta herramienta le permite pronosticar, analizar y valorar la fábrica de vinos Shanxi Xinghuacun Fen como un inversor experto.
What You Will Receive
- Comprehensive Financial Model: Utilize Shanxi Xinghuacun Fen Wine Factory’s actual data for accurate DCF valuation.
- Complete Forecast Flexibility: Modify revenue growth, profit margins, cost of capital (WACC), and other essential variables.
- Real-Time Calculations: Automatic updates allow you to view results instantly as you make adjustments.
- Professional-Grade Template: A polished Excel file crafted for high-quality valuation presentations.
- Adaptable and Repeatable: Designed for versatility, enabling ongoing use for detailed forecasting.
Key Features
- Comprehensive Historical Data: Access to Shanxi Xinghuacun Fen Wine Factory Co., Ltd.'s (600809SS) financial statements and pre-filled projections.
- Customizable Variables: Modify inputs such as WACC, tax rates, revenue growth, and EBITDA margins to suit your analysis.
- Real-Time Updates: Observe the recalibration of Shanxi Xinghuacun Fen Wine Factory Co., Ltd.'s (600809SS) intrinsic value as you adjust inputs.
- Intuitive Visual Displays: Clear dashboard charts illustrate valuation results and essential financial metrics.
- Designed for Precision: A reliable tool tailored for analysts, investors, and finance professionals.
How It Works
- Step 1: Download the prebuilt Excel template containing data for Shanxi Xinghuacun Fen Wine Factory Co., Ltd. (600809SS).
- Step 2: Review the pre-filled sheets to familiarize yourself with the key metrics.
- Step 3: Modify forecasts and assumptions in the editable yellow cells (WACC, growth, margins) as needed.
- Step 4: Instantly see recalculated results, including the intrinsic value of Shanxi Xinghuacun Fen Wine Factory Co., Ltd. (600809SS).
- Step 5: Utilize the outputs to make informed investment decisions or create comprehensive reports.
Reasons to Select Shanxi Xinghuacun Fen Wine Factory Co., Ltd. Calculator
- All-in-One Analysis: Offers a complete suite of tools including DCF, WACC, and financial ratio evaluations.
- Flexible Inputs: Modify the highlighted fields to explore different financial scenarios.
- In-Depth Analysis: Automatically computes the intrinsic value and Net Present Value for Shanxi Xinghuacun Fen Wine Factory Co., Ltd. (600809SS).
- Loaded with Data: Comes with historical and projected data for reliable analysis.
- Expert-Level Quality: Perfect for financial analysts, investors, and business consultants in the industry.
Who Can Benefit from This Product?
- Students of Winemaking: Discover fermentation techniques and apply them using authentic case studies.
- Researchers: Integrate industry practices into academic projects or studies.
- Investors: Validate your investment strategies and examine valuation metrics for Shanxi Xinghuacun Fen Wine Factory Co., Ltd. (600809SS).
- Market Analysts: Enhance your analysis with a ready-to-use, adjustable financial model.
- Small Scale Producers: Understand how major enterprises like Shanxi Xinghuacun are evaluated in the market.
What the Template Contains
- Pre-Filled DCF Model: Shanxi Xinghuacun Fen Wine Factory's financial data preloaded for immediate use.
- WACC Calculator: Comprehensive calculations for Weighted Average Cost of Capital.
- Financial Ratios: Assess the company's profitability, leverage, and operational efficiency.
- Editable Inputs: Modify assumptions such as growth rates, profit margins, and capital expenditures to suit your scenarios.
- Financial Statements: Annual and quarterly reports to facilitate thorough analysis.
- Interactive Dashboard: Visualize key valuation metrics and results with ease.
Disclaimer
All information, articles, and product details provided on this website are for general informational and educational purposes only. We do not claim any ownership over, nor do we intend to infringe upon, any trademarks, copyrights, logos, brand names, or other intellectual property mentioned or depicted on this site. Such intellectual property remains the property of its respective owners, and any references here are made solely for identification or informational purposes, without implying any affiliation, endorsement, or partnership.
We make no representations or warranties, express or implied, regarding the accuracy, completeness, or suitability of any content or products presented. Nothing on this website should be construed as legal, tax, investment, financial, medical, or other professional advice. In addition, no part of this site—including articles or product references—constitutes a solicitation, recommendation, endorsement, advertisement, or offer to buy or sell any securities, franchises, or other financial instruments, particularly in jurisdictions where such activity would be unlawful.
All content is of a general nature and may not address the specific circumstances of any individual or entity. It is not a substitute for professional advice or services. Any actions you take based on the information provided here are strictly at your own risk. You accept full responsibility for any decisions or outcomes arising from your use of this website and agree to release us from any liability in connection with your use of, or reliance upon, the content or products found herein.