
|
Valoración de DCF de la Incorporación del Grupo Orient (600811.SS) |
Completamente Editable: Adáptelo A Sus Necesidades En Excel O Sheets
Diseño Profesional: Plantillas Confiables Y Estándares De La Industria
Predeterminadas Para Un Uso Rápido Y Eficiente
Compatible con MAC / PC, completamente desbloqueado
No Se Necesita Experiencia; Fáciles De Seguir
Orient Group Incorporation (600811.SS) Bundle
¡Evalúe las perspectivas financieras de Orient Group Incorporation (600811SS) como un experto! Esta calculadora DCF (600811SS) proporciona datos financieros previamente llenos junto con la flexibilidad para modificar el crecimiento de los ingresos, WACC, los márgenes y otros supuestos cruciales para alinearse con sus proyecciones.
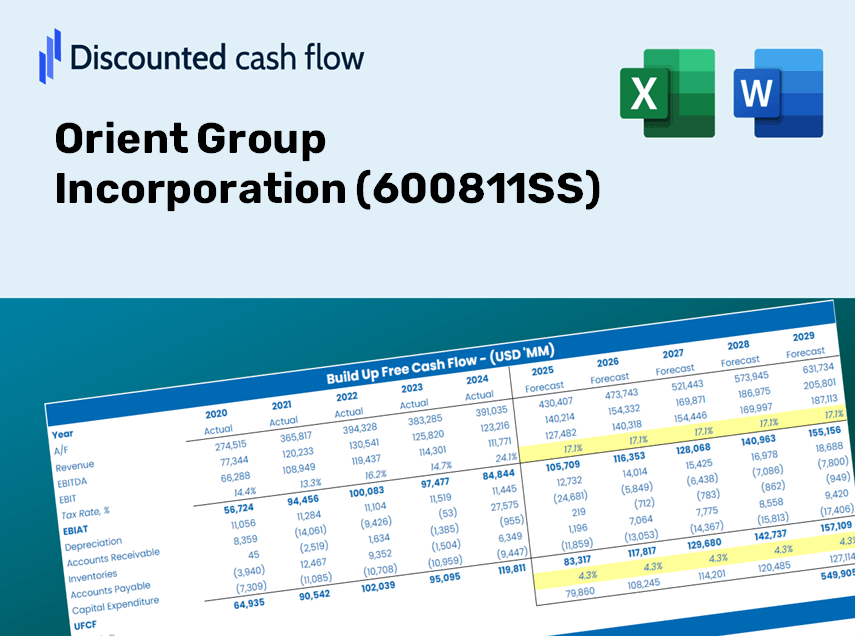
Discounted Cash Flow (DCF) - (USD MM)
| Year | AY1 2019 |
AY2 2020 |
AY3 2021 |
AY4 2022 |
AY5 2023 |
FY1 2024 |
FY2 2025 |
FY3 2026 |
FY4 2027 |
FY5 2028 |
|---|---|---|---|---|---|---|---|---|---|---|
| Revenue | 13,178.9 | 15,473.4 | 15,187.4 | 12,976.0 | 6,081.3 | 5,288.8 | 4,599.5 | 4,000.0 | 3,478.7 | 3,025.3 |
| Revenue Growth, % | 0 | 17.41 | -1.85 | -14.56 | -53.13 | -13.03 | -13.03 | -13.03 | -13.03 | -13.03 |
| EBITDA | 429.7 | 677.8 | -656.5 | 320.2 | -891.1 | -93.8 | -81.6 | -70.9 | -61.7 | -53.6 |
| EBITDA, % | 3.26 | 4.38 | -4.32 | 2.47 | -14.65 | -1.77 | -1.77 | -1.77 | -1.77 | -1.77 |
| Depreciation | 93.5 | 77.3 | 77.0 | 91.3 | 95.5 | 42.2 | 36.7 | 31.9 | 27.8 | 24.1 |
| Depreciation, % | 0.7097 | 0.49985 | 0.50719 | 0.70395 | 1.57 | 0.79809 | 0.79809 | 0.79809 | 0.79809 | 0.79809 |
| EBIT | 336.2 | 600.4 | -733.5 | 228.9 | -986.6 | -136.0 | -118.3 | -102.9 | -89.5 | -77.8 |
| EBIT, % | 2.55 | 3.88 | -4.83 | 1.76 | -16.22 | -2.57 | -2.57 | -2.57 | -2.57 | -2.57 |
| Total Cash | 5,029.6 | 6,271.3 | 4,642.8 | 5,187.1 | 3,185.5 | 2,132.6 | 1,854.7 | 1,613.0 | 1,402.7 | 1,219.9 |
| Total Cash, percent | .0 | .0 | .0 | .0 | .0 | .0 | .0 | .0 | .0 | .0 |
| Account Receivables | 224.8 | 336.1 | 326.9 | 338.2 | 306.5 | 144.7 | 125.8 | 109.4 | 95.1 | 82.7 |
| Account Receivables, % | 1.71 | 2.17 | 2.15 | 2.61 | 5.04 | 2.74 | 2.74 | 2.74 | 2.74 | 2.74 |
| Inventories | 9,605.2 | 8,860.0 | 7,952.5 | 7,171.1 | 6,725.1 | 3,572.7 | 3,107.1 | 2,702.2 | 2,350.0 | 2,043.7 |
| Inventories, % | 72.88 | 57.26 | 52.36 | 55.26 | 110.59 | 67.55 | 67.55 | 67.55 | 67.55 | 67.55 |
| Accounts Payable | 1,292.8 | 563.1 | 844.5 | 590.5 | 451.7 | 327.8 | 285.1 | 247.9 | 215.6 | 187.5 |
| Accounts Payable, % | 9.81 | 3.64 | 5.56 | 4.55 | 7.43 | 6.2 | 6.2 | 6.2 | 6.2 | 6.2 |
| Capital Expenditure | -228.4 | -204.3 | -97.2 | -65.3 | -59.9 | -54.8 | -47.7 | -41.5 | -36.1 | -31.4 |
| Capital Expenditure, % | -1.73 | -1.32 | -0.64017 | -0.50293 | -0.98563 | -1.04 | -1.04 | -1.04 | -1.04 | -1.04 |
| Tax Rate, % | 10.94 | 10.94 | 10.94 | 10.94 | 10.94 | 10.94 | 10.94 | 10.94 | 10.94 | 10.94 |
| EBITAT | 344.7 | 501.4 | -697.9 | 219.9 | -878.6 | -126.1 | -109.7 | -95.4 | -83.0 | -72.2 |
| Depreciation | ||||||||||
| Changes in Account Receivables | ||||||||||
| Changes in Inventories | ||||||||||
| Changes in Accounts Payable | ||||||||||
| Capital Expenditure | ||||||||||
| UFCF | -8,327.3 | 278.6 | 480.0 | 762.0 | -504.1 | 3,051.5 | 321.1 | 279.3 | 242.9 | 211.2 |
| WACC, % | 9.19 | 7.76 | 8.77 | 8.85 | 8.24 | 8.56 | 8.56 | 8.56 | 8.56 | 8.56 |
| PV UFCF | ||||||||||
| SUM PV UFCF | 3,616.4 | |||||||||
| Long Term Growth Rate, % | 2.00 | |||||||||
| Free cash flow (T + 1) | 215 | |||||||||
| Terminal Value | 3,283 | |||||||||
| Present Terminal Value | 2,177 | |||||||||
| Enterprise Value | 5,793 | |||||||||
| Net Debt | 8,197 | |||||||||
| Equity Value | -2,404 | |||||||||
| Diluted Shares Outstanding, MM | 3,659 | |||||||||
| Equity Value Per Share | -0.66 |
What You Will Receive
- Customizable Excel Template: A fully adaptable Excel-based DCF Calculator complete with pre-filled real financial data for Orient Group Incorporation (600811SS).
- Accurate Historical Data: Access to past performance data along with forward-looking estimates (highlighted in the yellow cells).
- Flexible Forecasting: Adjust your projections for revenue growth, EBITDA %, and WACC as needed.
- Instant Calculations: Quickly observe how your inputs influence the valuation of Orient Group Incorporation (600811SS).
- Professional-Grade Tool: Designed for investors, CFOs, consultants, and financial analysts alike.
- User-Friendly Interface: Organized for simplicity and ease of navigation, featuring step-by-step guidance.
Key Features
- Pre-Loaded Data: Orient Group Incorporation’s historical financial statements and pre-filled forecasts.
- Fully Adjustable Inputs: Customize WACC, tax rates, revenue growth, and EBITDA margins.
- Instant Results: View Orient Group Incorporation’s intrinsic value recalculated in real time.
- Clear Visual Outputs: Dashboard charts present valuation results and key metrics.
- Built for Accuracy: A professional tool tailored for analysts, investors, and finance experts.
How It Works
- Step 1: Download the Excel file.
- Step 2: Review the pre-filled data for Orient Group Incorporation (600811SS) including historical and projected figures.
- Step 3: Modify key assumptions (highlighted in yellow) based on your insights.
- Step 4: Observe the automatic recalculations reflecting Orient Group Incorporation's (600811SS) intrinsic value.
- Step 5: Utilize the results for your investment strategies or reporting needs.
Why Select the Orient Group Incorporation Calculator?
- Time Efficient: Skip the hassle of building a DCF model from the ground up – it's ready for immediate use.
- Enhanced Accuracy: Dependable financial data and formulas minimize valuation errors.
- Completely Customizable: Adjust the model to suit your specific assumptions and forecasts.
- Simple to Understand: Intuitive charts and outputs facilitate easy analysis of results.
- Endorsed by Professionals: Crafted for experts who prioritize precision and ease of use.
Who Should Use This Product?
- Investors: Evaluate Orient Group Incorporation’s (600811SS) valuation prior to making stock trades.
- CFOs and Financial Analysts: Optimize valuation workflows and validate financial forecasts.
- Startup Founders: Gain insights into how established companies like Orient Group Incorporation (600811SS) are valued.
- Consultants: Create comprehensive valuation reports for your clients.
- Students and Educators: Utilize real data to learn and teach valuation methodologies.
Contents of the Template
- Historical Data: A collection of Orient Group Incorporation's past financial performance and baseline projections.
- DCF and Levered DCF Models: Comprehensive templates designed to assess the intrinsic value of Orient Group Incorporation (600811SS).
- WACC Sheet: Pre-configured calculations for the Weighted Average Cost of Capital.
- Editable Inputs: Adjust essential parameters such as growth rates, EBITDA percentages, and CAPEX assumptions.
- Quarterly and Annual Statements: A thorough analysis of Orient Group Incorporation's financial statements.
- Interactive Dashboard: Dynamically visualize valuation outcomes and forecasts.
Disclaimer
All information, articles, and product details provided on this website are for general informational and educational purposes only. We do not claim any ownership over, nor do we intend to infringe upon, any trademarks, copyrights, logos, brand names, or other intellectual property mentioned or depicted on this site. Such intellectual property remains the property of its respective owners, and any references here are made solely for identification or informational purposes, without implying any affiliation, endorsement, or partnership.
We make no representations or warranties, express or implied, regarding the accuracy, completeness, or suitability of any content or products presented. Nothing on this website should be construed as legal, tax, investment, financial, medical, or other professional advice. In addition, no part of this site—including articles or product references—constitutes a solicitation, recommendation, endorsement, advertisement, or offer to buy or sell any securities, franchises, or other financial instruments, particularly in jurisdictions where such activity would be unlawful.
All content is of a general nature and may not address the specific circumstances of any individual or entity. It is not a substitute for professional advice or services. Any actions you take based on the information provided here are strictly at your own risk. You accept full responsibility for any decisions or outcomes arising from your use of this website and agree to release us from any liability in connection with your use of, or reliance upon, the content or products found herein.