
|
Shanghai Tunnel Engineering Co., Ltd. (600820.SS) Valoración de DCF |
Completamente Editable: Adáptelo A Sus Necesidades En Excel O Sheets
Diseño Profesional: Plantillas Confiables Y Estándares De La Industria
Predeterminadas Para Un Uso Rápido Y Eficiente
Compatible con MAC / PC, completamente desbloqueado
No Se Necesita Experiencia; Fáciles De Seguir
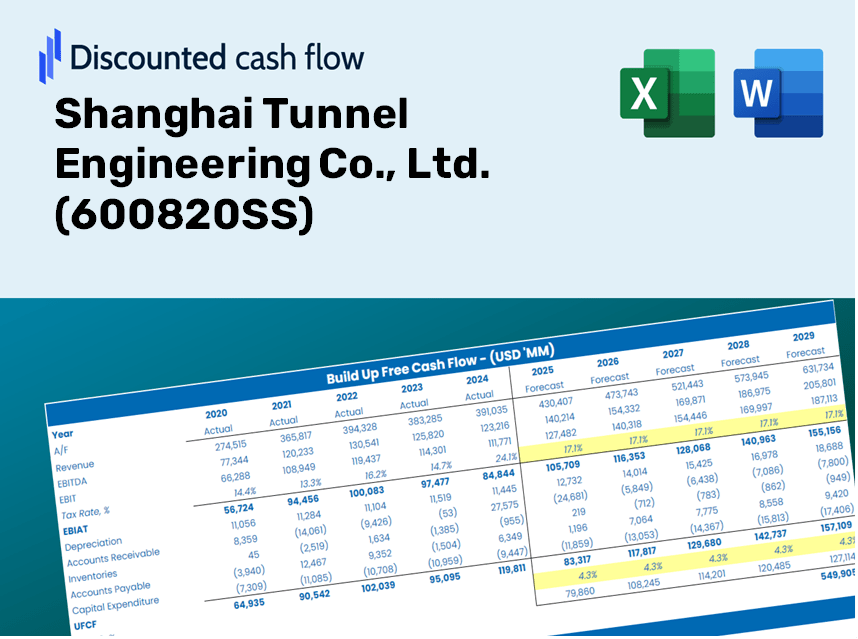
Shanghai Tunnel Engineering Co., Ltd. (600820.SS) Bundle
Ya sea que sea un inversionista o analista, esta calculadora DCF (600820SS) es su recurso para una valoración precisa. Cargados con datos reales de Shanghai Tunnel Engineering Co., Ltd., puede ajustar los pronósticos y observar los efectos en tiempo real.
Discounted Cash Flow (DCF) - (USD MM)
| Year | AY1 2020 |
AY2 2021 |
AY3 2022 |
AY4 2023 |
AY5 2024 |
FY1 2025 |
FY2 2026 |
FY3 2027 |
FY4 2028 |
FY5 2029 |
|---|---|---|---|---|---|---|---|---|---|---|
| Revenue | 54,014.2 | 62,226.1 | 72,296.9 | 74,215.7 | 68,815.5 | 72,871.1 | 77,165.6 | 81,713.2 | 86,528.9 | 91,628.3 |
| Revenue Growth, % | 0 | 15.2 | 16.18 | 2.65 | -7.28 | 5.89 | 5.89 | 5.89 | 5.89 | 5.89 |
| EBITDA | 3,090.6 | 5,100.1 | 5,380.6 | 3,919.4 | 4,853.6 | 4,910.7 | 5,200.1 | 5,506.6 | 5,831.1 | 6,174.7 |
| EBITDA, % | 5.72 | 8.2 | 7.44 | 5.28 | 7.05 | 6.74 | 6.74 | 6.74 | 6.74 | 6.74 |
| Depreciation | 756.9 | 872.8 | 1,162.9 | 1,497.6 | 1,247.8 | 1,201.4 | 1,272.2 | 1,347.2 | 1,426.6 | 1,510.7 |
| Depreciation, % | 1.4 | 1.4 | 1.61 | 2.02 | 1.81 | 1.65 | 1.65 | 1.65 | 1.65 | 1.65 |
| EBIT | 2,333.7 | 4,227.3 | 4,217.8 | 2,421.8 | 3,605.8 | 3,709.3 | 3,927.9 | 4,159.4 | 4,404.5 | 4,664.1 |
| EBIT, % | 4.32 | 6.79 | 5.83 | 3.26 | 5.24 | 5.09 | 5.09 | 5.09 | 5.09 | 5.09 |
| Total Cash | 16,959.5 | 17,992.9 | 18,943.9 | 21,818.1 | 24,393.3 | 22,059.8 | 23,359.9 | 24,736.6 | 26,194.4 | 27,738.1 |
| Total Cash, percent | .0 | .0 | .0 | .0 | .0 | .0 | .0 | .0 | .0 | .0 |
| Account Receivables | 34,825.6 | 42,830.4 | 56,827.9 | 60,613.9 | 70,698.5 | 57,361.4 | 60,741.9 | 64,321.6 | 68,112.3 | 72,126.4 |
| Account Receivables, % | 64.47 | 68.83 | 78.6 | 81.67 | 102.74 | 78.72 | 78.72 | 78.72 | 78.72 | 78.72 |
| Inventories | 606.1 | 704.2 | 627.3 | 1,174.5 | 1,158.9 | 931.0 | 985.9 | 1,044.0 | 1,105.5 | 1,170.7 |
| Inventories, % | 1.12 | 1.13 | 0.86771 | 1.58 | 1.68 | 1.28 | 1.28 | 1.28 | 1.28 | 1.28 |
| Accounts Payable | 35,136.8 | 50,663.0 | 65,443.5 | 73,599.3 | 78,546.4 | 63,566.7 | 67,312.9 | 71,279.9 | 75,480.6 | 79,929.0 |
| Accounts Payable, % | 65.05 | 81.42 | 90.52 | 99.17 | 114.14 | 87.23 | 87.23 | 87.23 | 87.23 | 87.23 |
| Capital Expenditure | -1,131.8 | -1,865.6 | -3,679.9 | -2,061.0 | -1,188.7 | -2,140.6 | -2,266.8 | -2,400.4 | -2,541.8 | -2,691.6 |
| Capital Expenditure, % | -2.1 | -3 | -5.09 | -2.78 | -1.73 | -2.94 | -2.94 | -2.94 | -2.94 | -2.94 |
| Tax Rate, % | 24.1 | 24.1 | 24.1 | 24.1 | 24.1 | 24.1 | 24.1 | 24.1 | 24.1 | 24.1 |
| EBITAT | 1,894.2 | 3,398.9 | 3,114.5 | 1,811.3 | 2,736.9 | 2,864.3 | 3,033.2 | 3,211.9 | 3,401.2 | 3,601.6 |
| Depreciation | ||||||||||
| Changes in Account Receivables | ||||||||||
| Changes in Inventories | ||||||||||
| Changes in Accounts Payable | ||||||||||
| Capital Expenditure | ||||||||||
| UFCF | 1,224.4 | 9,829.5 | 1,457.2 | 5,070.5 | -2,325.8 | 510.4 | 2,349.4 | 2,487.9 | 2,634.5 | 2,789.8 |
| WACC, % | 5.97 | 5.94 | 5.7 | 5.73 | 5.77 | 5.82 | 5.82 | 5.82 | 5.82 | 5.82 |
| PV UFCF | ||||||||||
| SUM PV UFCF | 8,882.6 | |||||||||
| Long Term Growth Rate, % | 0.50 | |||||||||
| Free cash flow (T + 1) | 2,804 | |||||||||
| Terminal Value | 52,671 | |||||||||
| Present Terminal Value | 39,689 | |||||||||
| Enterprise Value | 48,572 | |||||||||
| Net Debt | 3,383 | |||||||||
| Equity Value | 45,188 | |||||||||
| Diluted Shares Outstanding, MM | 3,157 | |||||||||
| Equity Value Per Share | 14.32 |
Benefits You Will Receive
- Customizable Excel Template: An adaptable Excel-based DCF Calculator featuring pre-populated financials for Shanghai Tunnel Engineering Co., Ltd. (600820SS).
- Comprehensive Data: Access to historical performance metrics and forward-looking projections (highlighted in the yellow cells).
- Flexible Forecasting: Modify key assumptions related to revenue growth, EBITDA %, and WACC to suit your analysis.
- Instant Calculations: Quickly observe how your inputs affect the valuation of Shanghai Tunnel Engineering Co., Ltd. (600820SS).
- Professional Resource: Designed for use by investors, CFOs, consultants, and financial analysts.
- Intuitive Layout: Organized for easy navigation and comprehension, complete with step-by-step guidance.
Key Features
- In-Depth Financial Data for [Symbol]: Comprehensive insights into Shanghai Tunnel Engineering Co., Ltd.'s historical performance and future growth forecasts.
- Customizable Financial Assumptions: Tailor revenue growth rates, profit margins, discount rates, tax obligations, and capital investment projections.
- Responsive Valuation Framework: Instantaneous recalibration of Net Present Value (NPV) and intrinsic value reflecting your customized inputs.
- Flexible Scenario Analysis: Generate various projection scenarios to evaluate different potential valuation results.
- Intuitive User Interface: Designed for ease of use, catering to both industry professionals and newcomers.
How It Works
- Download: Obtain the pre-configured Excel file featuring Shanghai Tunnel Engineering Co., Ltd.'s (600820SS) financial information.
- Customize: Modify forecasts, such as revenue growth, EBITDA %, and WACC.
- Update Automatically: The intrinsic value and NPV calculations refresh in real-time.
- Test Scenarios: Generate multiple projections and swiftly compare the results.
- Make Decisions: Utilize the valuation outputs to inform your investment approach.
Why Choose Shanghai Tunnel Engineering Co., Ltd. (600820SS)?
- Save Time: Avoid the hassle of building complex models from the ground up – our solutions are ready to go.
- Enhance Precision: Access to trustworthy data and methodologies minimizes valuation errors.
- Completely Customizable: Adjust the framework to align with your specific assumptions and forecasts.
- Simple to Understand: Intuitive graphs and outputs facilitate straightforward analysis of results.
- Backed by Professionals: Crafted for experts who prioritize accuracy and functionality.
Who Should Consider This Product?
- Individual Investors: Make well-informed choices regarding the purchase or sale of Shanghai Tunnel Engineering Co., Ltd. (600820SS).
- Financial Analysts: Enhance valuation processes with comprehensive financial models tailored for Shanghai Tunnel Engineering Co., Ltd. (600820SS).
- Consultants: Provide clients with timely and precise valuation insights related to Shanghai Tunnel Engineering Co., Ltd. (600820SS).
- Business Owners: Gain insights into how major engineering firms like Shanghai Tunnel Engineering Co., Ltd. (600820SS) are valued to refine your own business strategy.
- Finance Students: Explore valuation methodologies using real-world data and case studies centered around Shanghai Tunnel Engineering Co., Ltd. (600820SS).
Contents of the Template
- Pre-Filled DCF Model: Shanghai Tunnel Engineering Co., Ltd.’s (600820SS) financial data loaded for instant use.
- WACC Calculator: Comprehensive calculations for Weighted Average Cost of Capital.
- Financial Ratios: Assess Shanghai Tunnel Engineering Co., Ltd.’s (600820SS) profitability, leverage, and operational efficiency.
- Editable Inputs: Modify assumptions such as growth rates, profit margins, and capital expenditures to suit your analysis.
- Financial Statements: Access annual and quarterly reports to facilitate thorough evaluation.
- Interactive Dashboard: Effortlessly visualize essential valuation metrics and outcomes.
Disclaimer
All information, articles, and product details provided on this website are for general informational and educational purposes only. We do not claim any ownership over, nor do we intend to infringe upon, any trademarks, copyrights, logos, brand names, or other intellectual property mentioned or depicted on this site. Such intellectual property remains the property of its respective owners, and any references here are made solely for identification or informational purposes, without implying any affiliation, endorsement, or partnership.
We make no representations or warranties, express or implied, regarding the accuracy, completeness, or suitability of any content or products presented. Nothing on this website should be construed as legal, tax, investment, financial, medical, or other professional advice. In addition, no part of this site—including articles or product references—constitutes a solicitation, recommendation, endorsement, advertisement, or offer to buy or sell any securities, franchises, or other financial instruments, particularly in jurisdictions where such activity would be unlawful.
All content is of a general nature and may not address the specific circumstances of any individual or entity. It is not a substitute for professional advice or services. Any actions you take based on the information provided here are strictly at your own risk. You accept full responsibility for any decisions or outcomes arising from your use of this website and agree to release us from any liability in connection with your use of, or reliance upon, the content or products found herein.