
|
Shanghai New Power Automotive Technology Company Limited (600841.SS) Valoración de DCF |
Completamente Editable: Adáptelo A Sus Necesidades En Excel O Sheets
Diseño Profesional: Plantillas Confiables Y Estándares De La Industria
Predeterminadas Para Un Uso Rápido Y Eficiente
Compatible con MAC / PC, completamente desbloqueado
No Se Necesita Experiencia; Fáciles De Seguir
Shanghai New Power Automotive Technology Company Limited (600841.SS) Bundle
¿Busca determinar el valor intrínseco de Shanghai New Power Automotive Technology Company Limited? Nuestra calculadora DCF (600841SS) integra datos del mundo real con extensas funciones de personalización, lo que le permite ajustar las proyecciones y mejorar sus estrategias de inversión.
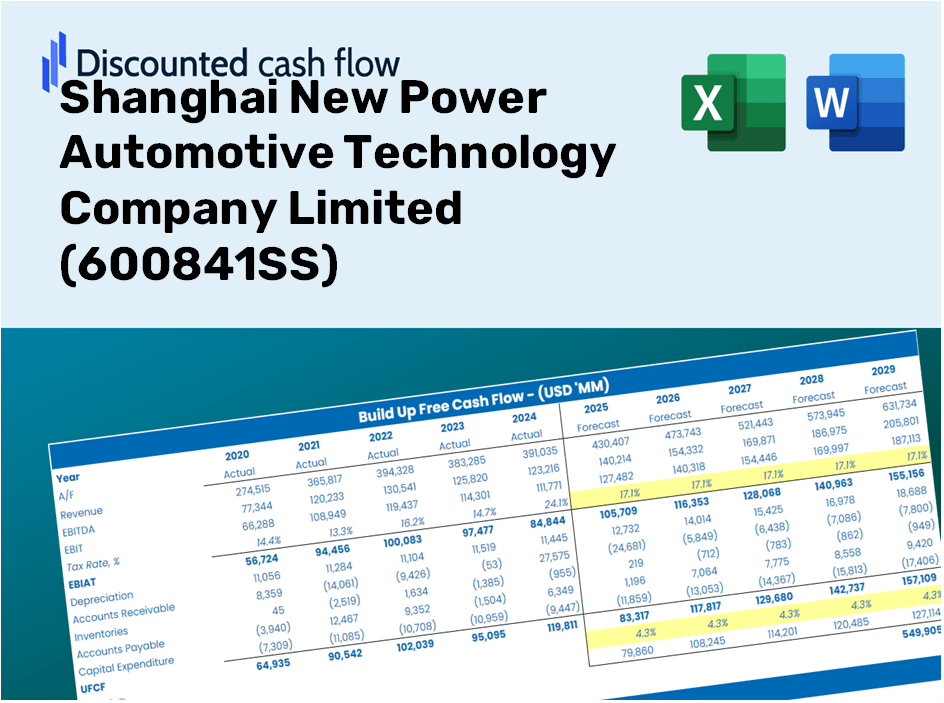
Discounted Cash Flow (DCF) - (USD MM)
| Year | AY1 2020 |
AY2 2021 |
AY3 2022 |
AY4 2023 |
AY5 2024 |
FY1 2025 |
FY2 2026 |
FY3 2027 |
FY4 2028 |
FY5 2029 |
|---|---|---|---|---|---|---|---|---|---|---|
| Revenue | 6,131.5 | 24,401.5 | 9,929.0 | 8,627.7 | 6,467.4 | 6,508.6 | 6,550.0 | 6,591.7 | 6,633.6 | 6,675.8 |
| Revenue Growth, % | 0 | 297.97 | -59.31 | -13.11 | -25.04 | 0.63628 | 0.63628 | 0.63628 | 0.63628 | 0.63628 |
| EBITDA | 715.2 | 1,224.1 | -1,146.1 | -1,778.4 | -1,541.3 | -511.7 | -514.9 | -518.2 | -521.5 | -524.8 |
| EBITDA, % | 11.66 | 5.02 | -11.54 | -20.61 | -23.83 | -7.86 | -7.86 | -7.86 | -7.86 | -7.86 |
| Depreciation | 349.5 | 393.5 | 393.8 | 387.4 | 315.2 | 268.7 | 270.4 | 272.1 | 273.9 | 275.6 |
| Depreciation, % | 5.7 | 1.61 | 3.97 | 4.49 | 4.87 | 4.13 | 4.13 | 4.13 | 4.13 | 4.13 |
| EBIT | 365.7 | 830.6 | -1,539.9 | -2,165.8 | -1,856.5 | -780.4 | -785.3 | -790.3 | -795.4 | -800.4 |
| EBIT, % | 5.96 | 3.4 | -15.51 | -25.1 | -28.71 | -11.99 | -11.99 | -11.99 | -11.99 | -11.99 |
| Total Cash | 3,035.4 | 6,290.8 | 6,904.2 | 6,215.2 | 4,833.2 | 3,795.7 | 3,819.8 | 3,844.1 | 3,868.6 | 3,893.2 |
| Total Cash, percent | .0 | .0 | .0 | .0 | .0 | .0 | .0 | .0 | .0 | .0 |
| Account Receivables | 6,568.2 | 8,694.0 | 7,753.6 | 5,271.4 | 2,569.8 | 4,094.6 | 4,120.6 | 4,146.9 | 4,173.2 | 4,199.8 |
| Account Receivables, % | 107.12 | 35.63 | 78.09 | 61.1 | 39.74 | 62.91 | 62.91 | 62.91 | 62.91 | 62.91 |
| Inventories | 777.3 | 2,293.4 | 1,818.3 | 1,584.8 | 1,017.9 | 969.7 | 975.9 | 982.1 | 988.4 | 994.7 |
| Inventories, % | 12.68 | 9.4 | 18.31 | 18.37 | 15.74 | 14.9 | 14.9 | 14.9 | 14.9 | 14.9 |
| Accounts Payable | 6,946.7 | 9,287.2 | 6,884.6 | 3,067.6 | 3,783.8 | 3,924.1 | 3,949.1 | 3,974.2 | 3,999.5 | 4,024.9 |
| Accounts Payable, % | 113.3 | 38.06 | 69.34 | 35.55 | 58.5 | 60.29 | 60.29 | 60.29 | 60.29 | 60.29 |
| Capital Expenditure | -121.1 | -554.6 | -442.2 | -496.5 | -516.9 | -292.2 | -294.1 | -295.9 | -297.8 | -299.7 |
| Capital Expenditure, % | -1.97 | -2.27 | -4.45 | -5.75 | -7.99 | -4.49 | -4.49 | -4.49 | -4.49 | -4.49 |
| Tax Rate, % | -0.56824 | -0.56824 | -0.56824 | -0.56824 | -0.56824 | -0.56824 | -0.56824 | -0.56824 | -0.56824 | -0.56824 |
| EBITAT | 403.0 | 702.2 | -1,631.8 | -2,184.7 | -1,867.1 | -756.3 | -761.1 | -765.9 | -770.8 | -775.7 |
| Depreciation | ||||||||||
| Changes in Account Receivables | ||||||||||
| Changes in Inventories | ||||||||||
| Changes in Accounts Payable | ||||||||||
| Capital Expenditure | ||||||||||
| UFCF | 232.5 | -760.2 | -2,667.3 | -3,395.0 | 1,915.9 | -2,116.0 | -792.0 | -797.0 | -802.1 | -807.2 |
| WACC, % | 11.04 | 10.82 | 11.04 | 11.04 | 11.04 | 11 | 11 | 11 | 11 | 11 |
| PV UFCF | ||||||||||
| SUM PV UFCF | -4,139.2 | |||||||||
| Long Term Growth Rate, % | 2.00 | |||||||||
| Free cash flow (T + 1) | -823 | |||||||||
| Terminal Value | -9,148 | |||||||||
| Present Terminal Value | -5,429 | |||||||||
| Enterprise Value | -9,568 | |||||||||
| Net Debt | -4,030 | |||||||||
| Equity Value | -5,539 | |||||||||
| Diluted Shares Outstanding, MM | 1,388 | |||||||||
| Equity Value Per Share | -3.99 |
What You Will Receive
- Genuine 600841SS Financial Data: Offers both historical and predictive information for precise valuation.
- Customizable Inputs: Adjust WACC, tax rates, revenue growth, and capital expenditure parameters as needed.
- Automated Calculations: Intrinsic value and NPV are computed in real-time.
- Scenario Analysis: Explore various scenarios to assess Shanghai New Power Automotive's potential future performance.
- User-Friendly Design: Designed for experts yet easy for newcomers to navigate.
Key Features
- Customizable Forecast Inputs: Adjust essential metrics such as revenue growth, EBITDA percentage, and capital expenditures.
- Instant DCF Valuation: Provides immediate calculations of intrinsic value, NPV, and other financial metrics.
- High-Precision Accuracy: Utilizes real-world data from Shanghai New Power Automotive Technology Company Limited (600841SS) for credible valuation results.
- Effortless Scenario Analysis: Easily explore various assumptions and assess their impacts on outcomes.
- Efficiency Enhancer: Remove the complexities of constructing detailed valuation models from the ground up.
How It Functions
- 1. Access the Template: Download and open the Excel file containing preloaded data for Shanghai New Power Automotive Technology Company Limited (600841SS).
- 2. Modify Assumptions: Adjust key parameters such as growth rates, WACC, and capital expenditures as needed.
- 3. Get Instant Results: The DCF model automatically computes intrinsic value and NPV in real-time.
- 4. Evaluate Scenarios: Explore various forecasts to assess different valuation outcomes.
- 5. Present with Assurance: Deliver professional valuation insights to facilitate your strategic decisions.
Why Choose This Calculator for Shanghai New Power Automotive Technology Company Limited (600841SS)?
- User-Friendly Interface: Tailored for both novices and seasoned professionals.
- Customizable Inputs: Modify parameters effortlessly to suit your analytical needs.
- Real-Time Adjustments: Instantly observe changes in valuation for Shanghai New Power as you update inputs.
- Pre-Loaded Data: Comes equipped with Shanghai New Power’s actual financial information for quick and easy analysis.
- Preferred by Industry Experts: Valued by investors and analysts for making well-informed decisions.
Who Can Benefit from This Product?
- Investors: Assess the fair value of Shanghai New Power Automotive Technology Company Limited (600841SS) effectively before making investment choices.
- CFOs: Utilize a comprehensive DCF model for financial reporting and analysis specific to the automotive sector.
- Consultants: Easily modify the template to create valuation reports tailored for clients in the automotive industry.
- Entrepreneurs: Discover financial modeling techniques employed by leading automotive firms.
- Educators: Employ it as an educational resource to illustrate various valuation methodologies.
Contents of the Template
- In-Depth DCF Model: Editable template featuring comprehensive valuation calculations.
- Market Data: Historical and projected financials for Shanghai New Power Automotive Technology Company Limited (600841SS) integrated for analysis.
- Adjustable Variables: Modify WACC, growth rates, and tax assumptions to explore different scenarios.
- Detailed Financial Statements: Complete annual and quarterly financial breakdowns for enhanced insights.
- Essential Ratios: Integrated analysis for assessing profitability, efficiency, and leverage.
- Visual Dashboard: Charts and tables presenting clear, actionable results.
Disclaimer
All information, articles, and product details provided on this website are for general informational and educational purposes only. We do not claim any ownership over, nor do we intend to infringe upon, any trademarks, copyrights, logos, brand names, or other intellectual property mentioned or depicted on this site. Such intellectual property remains the property of its respective owners, and any references here are made solely for identification or informational purposes, without implying any affiliation, endorsement, or partnership.
We make no representations or warranties, express or implied, regarding the accuracy, completeness, or suitability of any content or products presented. Nothing on this website should be construed as legal, tax, investment, financial, medical, or other professional advice. In addition, no part of this site—including articles or product references—constitutes a solicitation, recommendation, endorsement, advertisement, or offer to buy or sell any securities, franchises, or other financial instruments, particularly in jurisdictions where such activity would be unlawful.
All content is of a general nature and may not address the specific circumstances of any individual or entity. It is not a substitute for professional advice or services. Any actions you take based on the information provided here are strictly at your own risk. You accept full responsibility for any decisions or outcomes arising from your use of this website and agree to release us from any liability in connection with your use of, or reliance upon, the content or products found herein.