
|
Chengdu B-Ray Media Co., Ltd. (600880.ss) Valoración de DCF |
Completamente Editable: Adáptelo A Sus Necesidades En Excel O Sheets
Diseño Profesional: Plantillas Confiables Y Estándares De La Industria
Predeterminadas Para Un Uso Rápido Y Eficiente
Compatible con MAC / PC, completamente desbloqueado
No Se Necesita Experiencia; Fáciles De Seguir
Chengdu B-ray Media Co.,Ltd. (600880.SS) Bundle
¡Explore las perspectivas financieras de Chengdu B-Ray Media Co., Ltd. (600880SS) con nuestra calculadora DCF fácil de usar! Ingrese sus suposiciones con respecto al crecimiento, los márgenes y los gastos para calcular el valor intrínseco de Chengdu B-Ray Media Co., Ltd. (600880SS) y mejorar su estrategia de inversión.
What You Will Receive
- Flexible Forecast Inputs: Easily adjust key assumptions (growth %, margins, WACC) to explore various scenarios.
- Comprehensive Data: Chengdu B-ray Media Co., Ltd. (600880SS) financial data pre-loaded to enhance your analysis.
- Instant DCF Calculations: The template automatically computes Net Present Value (NPV) and intrinsic value for you.
- Professional and Adaptable: A refined Excel model that suits your valuation requirements.
- Designed for Analysts and Investors: Perfect for evaluating projections, verifying strategies, and optimizing time efficiency.
Key Features
- 🔍 Real-Life (600880SS) Financials: Pre-filled historical and projected data for Chengdu B-ray Media Co., Ltd.
- ✏️ Fully Customizable Inputs: Modify all essential parameters (yellow cells) such as WACC, growth %, and tax rates.
- 📊 Professional DCF Valuation: Integrated formulas compute Chengdu B-ray Media’s intrinsic value using the Discounted Cash Flow method.
- ⚡ Instant Results: View Chengdu B-ray Media’s valuation immediately after changes are made.
- Scenario Analysis: Evaluate and compare various financial assumptions side by side.
How It Works
- Step 1: Download the prebuilt Excel template featuring Chengdu B-ray Media Co.,Ltd.'s (600880SS) data.
- Step 2: Review the pre-filled sheets to familiarize yourself with the key performance indicators.
- Step 3: Modify forecasts and assumptions in the editable yellow cells (WACC, growth, margins).
- Step 4: Instantly see updated results, including Chengdu B-ray Media Co.,Ltd.'s (600880SS) intrinsic value.
- Step 5: Use the outputs to make informed investment decisions or generate comprehensive reports.
Why Opt for This Calculator?
- Reliable Data: Up-to-date financials for Chengdu B-ray Media Co., Ltd. ensure trustworthy valuation outcomes.
- Flexible Options: Modify essential variables such as growth rates, WACC, and tax rates to align with your forecasts.
- Efficiency Boost: Pre-configured calculations save you from starting from square one.
- High-Quality Tool: Tailored for investors, analysts, and consultants.
- Easy to Use: User-friendly design and comprehensive guidance make it accessible to everyone.
Who Should Use This Product?
- Investors: Accurately assess the fair value of Chengdu B-ray Media Co., Ltd. (600880SS) before making investment choices.
- CFOs: Utilize a professional-grade DCF model for financial analysis and reporting.
- Consultants: Easily customize the template for client valuation reports.
- Entrepreneurs: Acquire insights into financial modeling practices employed by leading industry players.
- Educators: Employ it as an educational resource to illustrate valuation techniques.
Contents of the Template
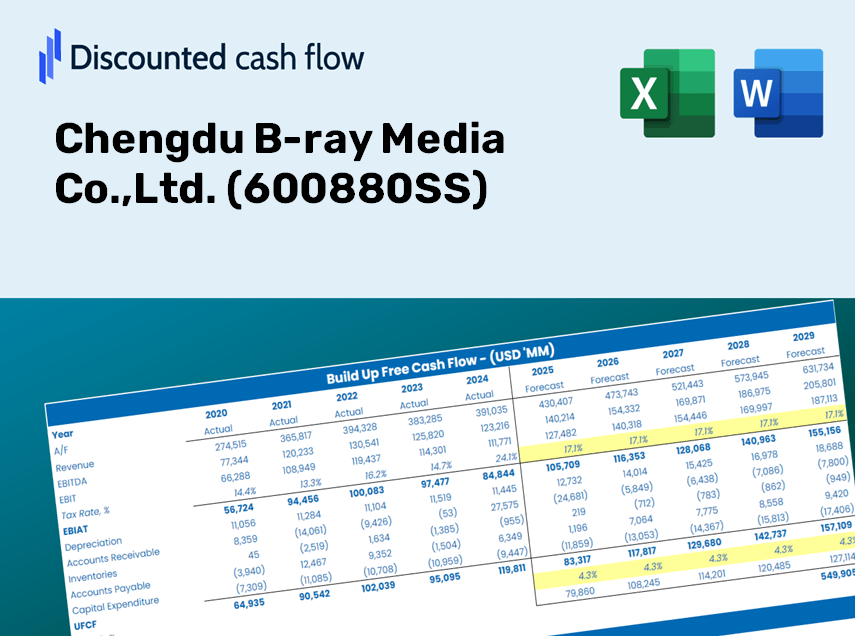
- Operating and Balance Sheet Data: Pre-filled historical data and forecasts for Chengdu B-ray Media Co., Ltd. (600880SS), including revenue, EBITDA, EBIT, and capital expenditures.
- WACC Calculation: A specific sheet dedicated to the Weighted Average Cost of Capital (WACC), featuring key parameters such as Beta, risk-free rate, and share price.
- DCF Valuation (Unlevered and Levered): Editable Discounted Cash Flow models presenting intrinsic value with comprehensive calculations.
- Financial Statements: Pre-loaded financial statements (annual and quarterly) to facilitate analysis.
- Key Ratios: Contains profitability, leverage, and efficiency ratios for Chengdu B-ray Media Co., Ltd. (600880SS).
- Dashboard and Charts: A visual summary of valuation outputs and assumptions for straightforward analysis of results.
Disclaimer
All information, articles, and product details provided on this website are for general informational and educational purposes only. We do not claim any ownership over, nor do we intend to infringe upon, any trademarks, copyrights, logos, brand names, or other intellectual property mentioned or depicted on this site. Such intellectual property remains the property of its respective owners, and any references here are made solely for identification or informational purposes, without implying any affiliation, endorsement, or partnership.
We make no representations or warranties, express or implied, regarding the accuracy, completeness, or suitability of any content or products presented. Nothing on this website should be construed as legal, tax, investment, financial, medical, or other professional advice. In addition, no part of this site—including articles or product references—constitutes a solicitation, recommendation, endorsement, advertisement, or offer to buy or sell any securities, franchises, or other financial instruments, particularly in jurisdictions where such activity would be unlawful.
All content is of a general nature and may not address the specific circumstances of any individual or entity. It is not a substitute for professional advice or services. Any actions you take based on the information provided here are strictly at your own risk. You accept full responsibility for any decisions or outcomes arising from your use of this website and agree to release us from any liability in connection with your use of, or reliance upon, the content or products found herein.