
|
Xinjiang Joinworld Co., Ltd. (600888.ss) Valoración de DCF |
Completamente Editable: Adáptelo A Sus Necesidades En Excel O Sheets
Diseño Profesional: Plantillas Confiables Y Estándares De La Industria
Predeterminadas Para Un Uso Rápido Y Eficiente
Compatible con MAC / PC, completamente desbloqueado
No Se Necesita Experiencia; Fáciles De Seguir
Xinjiang Joinworld Co.,Ltd. (600888.SS) Bundle
Diseñada para la precisión, nuestra calculadora DCF (600888SS) lo ayuda a evaluar Xinjiang Joinworld Co., Ltd. Valoración utilizando datos financieros del mundo real y ofrece una flexibilidad completa para modificar todos los parámetros esenciales para mejorar las proyecciones.
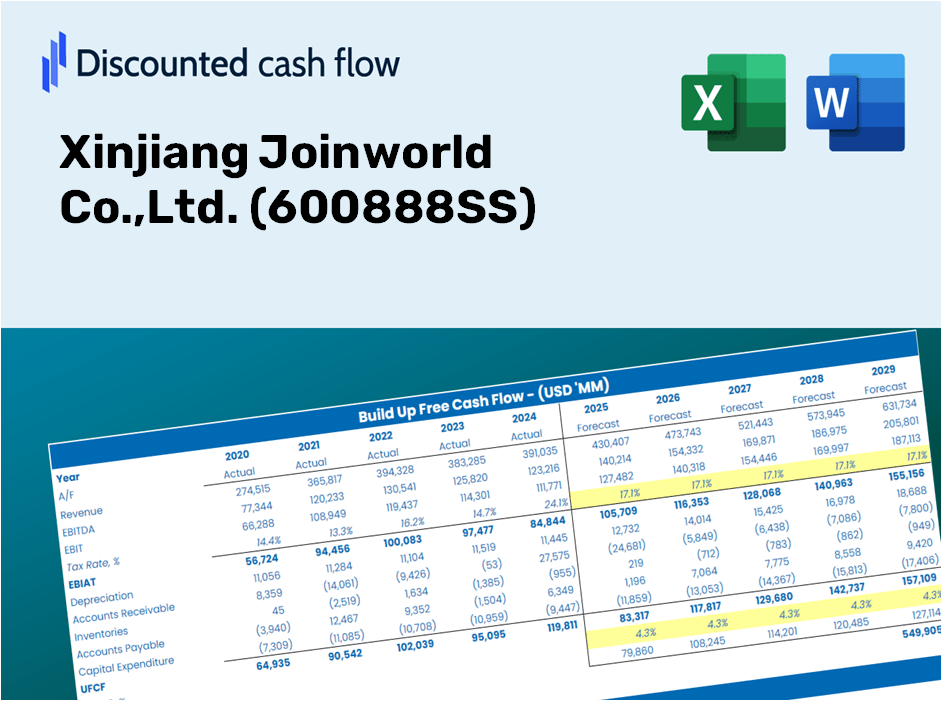
Discounted Cash Flow (DCF) - (USD MM)
| Year | AY1 2020 |
AY2 2021 |
AY3 2022 |
AY4 2023 |
AY5 2024 |
FY1 2025 |
FY2 2026 |
FY3 2027 |
FY4 2028 |
FY5 2029 |
|---|---|---|---|---|---|---|---|---|---|---|
| Revenue | 5,717.1 | 8,225.5 | 7,735.4 | 6,534.7 | 7,320.9 | 7,424.9 | 7,530.4 | 7,637.3 | 7,745.7 | 7,855.7 |
| Revenue Growth, % | 0 | 43.88 | -5.96 | -15.52 | 12.03 | 1.42 | 1.42 | 1.42 | 1.42 | 1.42 |
| EBITDA | 965.5 | 1,488.0 | 2,227.1 | 2,250.3 | 1,984.0 | 1,860.7 | 1,887.2 | 1,914.0 | 1,941.1 | 1,968.7 |
| EBITDA, % | 16.89 | 18.09 | 28.79 | 34.44 | 27.1 | 25.06 | 25.06 | 25.06 | 25.06 | 25.06 |
| Depreciation | 394.8 | 439.1 | 480.3 | 503.2 | 592.0 | 508.5 | 515.7 | 523.0 | 530.4 | 538.0 |
| Depreciation, % | 6.91 | 5.34 | 6.21 | 7.7 | 8.09 | 6.85 | 6.85 | 6.85 | 6.85 | 6.85 |
| EBIT | 570.6 | 1,048.9 | 1,746.8 | 1,747.0 | 1,392.0 | 1,352.3 | 1,371.5 | 1,391.0 | 1,410.7 | 1,430.7 |
| EBIT, % | 9.98 | 12.75 | 22.58 | 26.73 | 19.01 | 18.21 | 18.21 | 18.21 | 18.21 | 18.21 |
| Total Cash | 1,494.9 | 2,041.2 | 1,904.3 | 3,061.9 | 3,401.3 | 2,508.1 | 2,543.7 | 2,579.8 | 2,616.5 | 2,653.6 |
| Total Cash, percent | .0 | .0 | .0 | .0 | .0 | .0 | .0 | .0 | .0 | .0 |
| Account Receivables | 1,298.5 | 2,174.4 | 1,298.2 | 1,580.6 | 2,240.6 | 1,792.7 | 1,818.2 | 1,844.0 | 1,870.2 | 1,896.8 |
| Account Receivables, % | 22.71 | 26.44 | 16.78 | 24.19 | 30.61 | 24.14 | 24.14 | 24.14 | 24.14 | 24.14 |
| Inventories | 1,364.5 | 1,493.4 | 1,722.3 | 1,855.6 | 1,714.7 | 1,724.2 | 1,748.6 | 1,773.5 | 1,798.7 | 1,824.2 |
| Inventories, % | 23.87 | 18.16 | 22.27 | 28.4 | 23.42 | 23.22 | 23.22 | 23.22 | 23.22 | 23.22 |
| Accounts Payable | 1,207.9 | 1,568.8 | 1,409.8 | 1,948.2 | 734.8 | 1,459.4 | 1,480.1 | 1,501.1 | 1,522.4 | 1,544.1 |
| Accounts Payable, % | 21.13 | 19.07 | 18.23 | 29.81 | 10.04 | 19.66 | 19.66 | 19.66 | 19.66 | 19.66 |
| Capital Expenditure | -250.3 | -199.3 | -189.6 | -272.2 | -262.8 | -252.6 | -256.2 | -259.8 | -263.5 | -267.2 |
| Capital Expenditure, % | -4.38 | -2.42 | -2.45 | -4.17 | -3.59 | -3.4 | -3.4 | -3.4 | -3.4 | -3.4 |
| Tax Rate, % | 5.83 | 5.83 | 5.83 | 5.83 | 5.83 | 5.83 | 5.83 | 5.83 | 5.83 | 5.83 |
| EBITAT | 557.5 | 1,031.5 | 1,651.4 | 1,662.9 | 1,310.9 | 1,298.0 | 1,316.5 | 1,335.2 | 1,354.1 | 1,373.4 |
| Depreciation | ||||||||||
| Changes in Account Receivables | ||||||||||
| Changes in Inventories | ||||||||||
| Changes in Accounts Payable | ||||||||||
| Capital Expenditure | ||||||||||
| UFCF | -753.0 | 627.3 | 2,430.4 | 2,016.6 | -92.4 | 2,716.9 | 1,546.8 | 1,568.7 | 1,591.0 | 1,613.6 |
| WACC, % | 4.47 | 4.48 | 4.45 | 4.45 | 4.45 | 4.46 | 4.46 | 4.46 | 4.46 | 4.46 |
| PV UFCF | ||||||||||
| SUM PV UFCF | 8,028.2 | |||||||||
| Long Term Growth Rate, % | 3.50 | |||||||||
| Free cash flow (T + 1) | 1,670 | |||||||||
| Terminal Value | 173,937 | |||||||||
| Present Terminal Value | 139,842 | |||||||||
| Enterprise Value | 147,870 | |||||||||
| Net Debt | -327 | |||||||||
| Equity Value | 148,197 | |||||||||
| Diluted Shares Outstanding, MM | 1,408 | |||||||||
| Equity Value Per Share | 105.26 |
What You Will Receive
- Genuine 600888SS Financial Data: Pre-loaded with Xinjiang Joinworld's historical and projected figures for detailed analysis.
- Completely Customizable Template: Effortlessly adjust key variables such as revenue growth, WACC, and EBITDA margin.
- Instant Calculations: Watch the intrinsic value of Xinjiang Joinworld update in real-time as you make modifications.
- Professional Valuation Tool: Tailored for investors, analysts, and consultants aiming for precise DCF outcomes.
- User-Friendly Format: Intuitive layout and straightforward guidelines suitable for all skill levels.
Key Features
- Authentic Xinjiang Joinworld Financials: Gain access to precise historical data and forecasts tailored for [600888SS].
- Adjustable Forecast Parameters: Modify the highlighted fields, including WACC, growth rates, and profit margins.
- Real-Time Calculations: Automatic recalculations of DCF, Net Present Value (NPV), and cash flow assessments.
- Interactive Dashboard: User-friendly charts and summaries to clearly present your valuation findings.
- Designed for All Skill Levels: An intuitive layout ideal for investors, CFOs, and consultants, whether you're a novice or an expert.
How It Operates
- Step 1: Download the Excel file.
- Step 2: Examine the pre-filled data for Xinjiang Joinworld Co., Ltd. (600888SS) (historical and forecasted).
- Step 3: Modify critical assumptions (yellow cells) based on your findings.
- Step 4: Observe the automatic recalculations of Xinjiang Joinworld Co., Ltd.'s (600888SS) intrinsic value.
- Step 5: Utilize the results for investment decisions or reporting purposes.
Why Choose This Calculator for Xinjiang Joinworld Co., Ltd. (600888SS)?
- User-Friendly Design: Perfectly crafted for both novice and seasoned users.
- Customizable Inputs: Easily adjust parameters to suit your evaluation needs.
- Real-Time Adjustments: Observe immediate updates to Xinjiang Joinworld's valuation as you change inputs.
- Pre-Configured Data: Comes with Xinjiang Joinworld’s current financial metrics for swift analysis.
- Preferred by Experts: Valued by analysts and investors for making educated decisions.
Who Can Benefit from This Product?
- Investors: Accurately assess the fair value of Xinjiang Joinworld Co., Ltd. (600888SS) prior to making investment choices.
- CFOs: Utilize a high-quality DCF model for comprehensive financial reporting and analysis.
- Consultants: Easily modify the template to create valuation reports tailored for clients.
- Entrepreneurs: Acquire knowledge on financial modeling practices employed by leading companies.
- Educators: Implement this resource as a teaching aid to illustrate valuation techniques.
Contents of the Template
- Pre-Filled DCF Model: Financial data for Xinjiang Joinworld Co., Ltd. (600888SS) preloaded for immediate application.
- WACC Calculator: Comprehensive calculations for the Weighted Average Cost of Capital.
- Financial Ratios: Assess Xinjiang Joinworld’s profitability, leverage, and operational efficiency.
- Editable Inputs: Customize assumptions such as growth rates, profit margins, and CAPEX to suit your scenarios.
- Financial Statements: Access to annual and quarterly reports for in-depth analysis.
- Interactive Dashboard: Effortlessly visualize key valuation metrics and outcomes.
Disclaimer
All information, articles, and product details provided on this website are for general informational and educational purposes only. We do not claim any ownership over, nor do we intend to infringe upon, any trademarks, copyrights, logos, brand names, or other intellectual property mentioned or depicted on this site. Such intellectual property remains the property of its respective owners, and any references here are made solely for identification or informational purposes, without implying any affiliation, endorsement, or partnership.
We make no representations or warranties, express or implied, regarding the accuracy, completeness, or suitability of any content or products presented. Nothing on this website should be construed as legal, tax, investment, financial, medical, or other professional advice. In addition, no part of this site—including articles or product references—constitutes a solicitation, recommendation, endorsement, advertisement, or offer to buy or sell any securities, franchises, or other financial instruments, particularly in jurisdictions where such activity would be unlawful.
All content is of a general nature and may not address the specific circumstances of any individual or entity. It is not a substitute for professional advice or services. Any actions you take based on the information provided here are strictly at your own risk. You accept full responsibility for any decisions or outcomes arising from your use of this website and agree to release us from any liability in connection with your use of, or reliance upon, the content or products found herein.