
|
Guizhou Gas Group Corporation Ltd. (600903.ss) DCF Valoración |
Completamente Editable: Adáptelo A Sus Necesidades En Excel O Sheets
Diseño Profesional: Plantillas Confiables Y Estándares De La Industria
Predeterminadas Para Un Uso Rápido Y Eficiente
Compatible con MAC / PC, completamente desbloqueado
No Se Necesita Experiencia; Fáciles De Seguir
Guizhou Gas Group Corporation Ltd. (600903.SS) Bundle
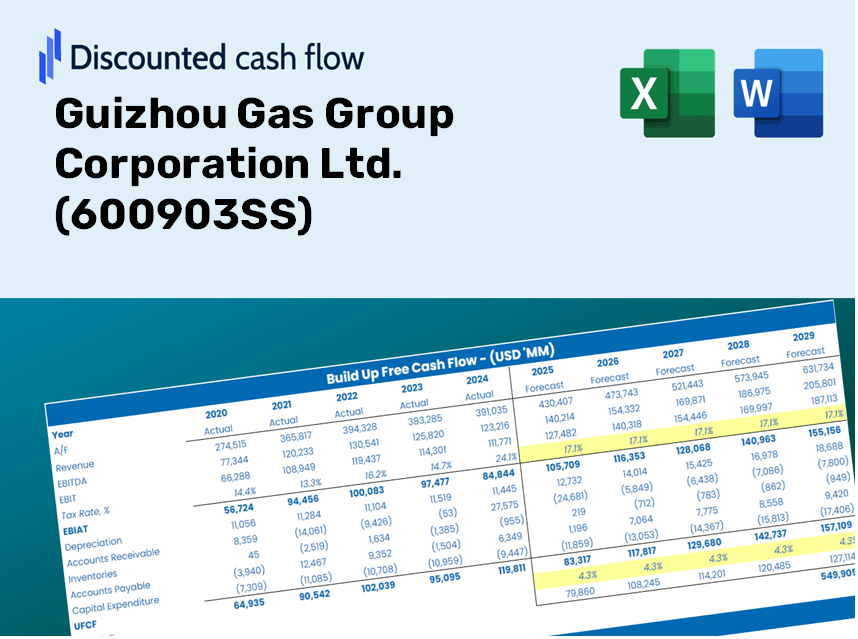
¡Evalúe las perspectivas financieras de Guizhou Gas Group Corporation Ltd. como un experto! Esta calculadora DCF (600903SS) proporciona datos financieros previamente llenos y flexibilidad completa para modificar el crecimiento de los ingresos, WACC, los márgenes y otros supuestos críticos para alinearse con sus pronósticos.
Discounted Cash Flow (DCF) - (USD MM)
| Year | AY1 2020 |
AY2 2021 |
AY3 2022 |
AY4 2023 |
AY5 2024 |
FY1 2025 |
FY2 2026 |
FY3 2027 |
FY4 2028 |
FY5 2029 |
|---|---|---|---|---|---|---|---|---|---|---|
| Revenue | 4,244.1 | 5,087.7 | 6,163.2 | 6,097.6 | 6,680.1 | 7,506.8 | 8,435.8 | 9,479.8 | 10,653.0 | 11,971.4 |
| Revenue Growth, % | 0 | 19.88 | 21.14 | -1.06 | 9.55 | 12.38 | 12.38 | 12.38 | 12.38 | 12.38 |
| EBITDA | 654.5 | 613.7 | 522.7 | 687.7 | 657.6 | 857.1 | 963.2 | 1,082.4 | 1,216.3 | 1,366.8 |
| EBITDA, % | 15.42 | 12.06 | 8.48 | 11.28 | 9.84 | 11.42 | 11.42 | 11.42 | 11.42 | 11.42 |
| Depreciation | 273.6 | 280.5 | 284.8 | 305.4 | 305.5 | 392.8 | 441.4 | 496.0 | 557.4 | 626.4 |
| Depreciation, % | 6.45 | 5.51 | 4.62 | 5.01 | 4.57 | 5.23 | 5.23 | 5.23 | 5.23 | 5.23 |
| EBIT | 380.9 | 333.1 | 237.9 | 382.4 | 352.2 | 464.3 | 521.8 | 586.3 | 658.9 | 740.4 |
| EBIT, % | 8.98 | 6.55 | 3.86 | 6.27 | 5.27 | 6.19 | 6.19 | 6.19 | 6.19 | 6.19 |
| Total Cash | 571.0 | 1,442.0 | 1,008.7 | 725.5 | 507.9 | 1,166.1 | 1,310.4 | 1,472.5 | 1,654.8 | 1,859.6 |
| Total Cash, percent | .0 | .0 | .0 | .0 | .0 | .0 | .0 | .0 | .0 | .0 |
| Account Receivables | 978.3 | 1,181.8 | 1,255.9 | 986.4 | 1,185.4 | 1,510.0 | 1,696.9 | 1,906.9 | 2,142.9 | 2,408.2 |
| Account Receivables, % | 23.05 | 23.23 | 20.38 | 16.18 | 17.74 | 20.12 | 20.12 | 20.12 | 20.12 | 20.12 |
| Inventories | 369.7 | 396.4 | 377.3 | 349.1 | 379.4 | 510.9 | 574.1 | 645.1 | 725.0 | 814.7 |
| Inventories, % | 8.71 | 7.79 | 6.12 | 5.72 | 5.68 | 6.81 | 6.81 | 6.81 | 6.81 | 6.81 |
| Accounts Payable | 666.3 | 627.1 | 642.1 | 555.1 | 614.7 | 852.0 | 957.4 | 1,075.9 | 1,209.1 | 1,358.7 |
| Accounts Payable, % | 15.7 | 12.33 | 10.42 | 9.1 | 9.2 | 11.35 | 11.35 | 11.35 | 11.35 | 11.35 |
| Capital Expenditure | -629.5 | -575.8 | -1,004.2 | -1,058.4 | -758.8 | -1,068.4 | -1,200.6 | -1,349.2 | -1,516.1 | -1,703.8 |
| Capital Expenditure, % | -14.83 | -11.32 | -16.29 | -17.36 | -11.36 | -14.23 | -14.23 | -14.23 | -14.23 | -14.23 |
| Tax Rate, % | 63.83 | 63.83 | 63.83 | 63.83 | 63.83 | 63.83 | 63.83 | 63.83 | 63.83 | 63.83 |
| EBITAT | 299.8 | 256.0 | 113.6 | 142.6 | 127.4 | 257.0 | 288.8 | 324.6 | 364.8 | 409.9 |
| Depreciation | ||||||||||
| Changes in Account Receivables | ||||||||||
| Changes in Inventories | ||||||||||
| Changes in Accounts Payable | ||||||||||
| Capital Expenditure | ||||||||||
| UFCF | -737.7 | -308.7 | -645.7 | -399.7 | -495.7 | -637.4 | -615.0 | -691.1 | -776.7 | -872.8 |
| WACC, % | 4.31 | 4.29 | 3.9 | 3.75 | 3.74 | 4 | 4 | 4 | 4 | 4 |
| PV UFCF | ||||||||||
| SUM PV UFCF | -3,177.3 | |||||||||
| Long Term Growth Rate, % | 3.00 | |||||||||
| Free cash flow (T + 1) | -899 | |||||||||
| Terminal Value | -90,059 | |||||||||
| Present Terminal Value | -74,029 | |||||||||
| Enterprise Value | -77,206 | |||||||||
| Net Debt | 4,399 | |||||||||
| Equity Value | -81,605 | |||||||||
| Diluted Shares Outstanding, MM | 1,250 | |||||||||
| Equity Value Per Share | -65.27 |
What You Will Receive
- Adjustable Forecast Parameters: Effortlessly modify key assumptions (growth %, margins, WACC) to explore various scenarios.
- Industry-Specific Data: Guizhou Gas Group Corporation Ltd. (600903SS) financial data pre-loaded to facilitate your analysis.
- Instant DCF Calculations: The template automatically computes Net Present Value (NPV) and intrinsic value for your convenience.
- Customizable and Professional Design: An elegant Excel model tailored to meet your valuation requirements.
- Designed for Analysts and Investors: Perfect for evaluating forecasts, validating strategies, and enhancing efficiency.
Key Features
- Comprehensive DCF Calculator: Offers intricate unlevered and levered DCF valuation models tailored for Guizhou Gas Group Corporation Ltd. (600903SS).
- WACC Analysis Tool: Features a pre-configured Weighted Average Cost of Capital spreadsheet with adjustable parameters.
- Customizable Forecast Assumptions: Easily adjust growth projections, capital expenditure estimates, and discount rates.
- Integrated Financial Ratios: Evaluate key profitability, leverage, and efficiency ratios specifically for Guizhou Gas Group Corporation Ltd. (600903SS).
- Visual Dashboard and Charts: Present graphical representations that highlight essential valuation metrics for straightforward analysis.
How It Works
- Download: Obtain the ready-to-use Excel file featuring Guizhou Gas Group Corporation Ltd.'s (600903SS) financial data.
- Customize: Modify forecasts, such as revenue growth, EBITDA %, and WACC.
- Update Automatically: Enjoy real-time updates for intrinsic value and NPV calculations.
- Test Scenarios: Develop multiple projections and compare results instantly.
- Make Decisions: Leverage the valuation outcomes to inform your investment strategies.
Why Select This Calculator?
- User-Friendly Design: Tailored for both novices and seasoned users.
- Customizable Inputs: Effortlessly adjust parameters to suit your analysis.
- Real-Time Updates: Monitor immediate changes in Guizhou Gas Group Corporation Ltd. (600903SS) valuation as you tweak settings.
- Preconfigured Data: Comes loaded with Guizhou Gas Group Corporation Ltd. (600903SS) actual financial information for swift evaluations.
- Relied Upon by Experts: Employed by analysts and investors for data-driven decision-making.
Who Should Consider This Product?
- Individual Investors: Gain the knowledge needed to make educated decisions regarding investments in Guizhou Gas Group Corporation Ltd. (600903SS).
- Financial Analysts: Enhance valuation activities with accessible financial models tailored for Guizhou Gas Group Corporation Ltd. (600903SS).
- Consultants: Provide clients with accurate and timely valuation insights for Guizhou Gas Group Corporation Ltd. (600903SS).
- Business Owners: Learn how leading companies like Guizhou Gas Group Corporation Ltd. (600903SS) are appraised to inform your own business strategies.
- Finance Students: Acquire practical valuation skills using the real-world context of Guizhou Gas Group Corporation Ltd. (600903SS).
Overview of the Template Contents
- Preloaded 600903SS Data: Historical and forecasted financial metrics, including revenue, EBIT, and capital expenditures.
- DCF and WACC Models: Advanced spreadsheets for determining intrinsic value and Weighted Average Cost of Capital.
- Editable Inputs: Cells highlighted in yellow for modifying revenue growth, tax rates, and discount rates.
- Financial Statements: Detailed annual and quarterly financial reports for in-depth analysis.
- Key Ratios: Metrics for profitability, leverage, and efficiency to assess performance.
- Dashboard and Charts: Visual representations of valuation results and underlying assumptions.
Disclaimer
All information, articles, and product details provided on this website are for general informational and educational purposes only. We do not claim any ownership over, nor do we intend to infringe upon, any trademarks, copyrights, logos, brand names, or other intellectual property mentioned or depicted on this site. Such intellectual property remains the property of its respective owners, and any references here are made solely for identification or informational purposes, without implying any affiliation, endorsement, or partnership.
We make no representations or warranties, express or implied, regarding the accuracy, completeness, or suitability of any content or products presented. Nothing on this website should be construed as legal, tax, investment, financial, medical, or other professional advice. In addition, no part of this site—including articles or product references—constitutes a solicitation, recommendation, endorsement, advertisement, or offer to buy or sell any securities, franchises, or other financial instruments, particularly in jurisdictions where such activity would be unlawful.
All content is of a general nature and may not address the specific circumstances of any individual or entity. It is not a substitute for professional advice or services. Any actions you take based on the information provided here are strictly at your own risk. You accept full responsibility for any decisions or outcomes arising from your use of this website and agree to release us from any liability in connection with your use of, or reliance upon, the content or products found herein.