
|
Huaan Securities Co., Ltd. (600909.ss) Valoración de DCF |
Completamente Editable: Adáptelo A Sus Necesidades En Excel O Sheets
Diseño Profesional: Plantillas Confiables Y Estándares De La Industria
Predeterminadas Para Un Uso Rápido Y Eficiente
Compatible con MAC / PC, completamente desbloqueado
No Se Necesita Experiencia; Fáciles De Seguir
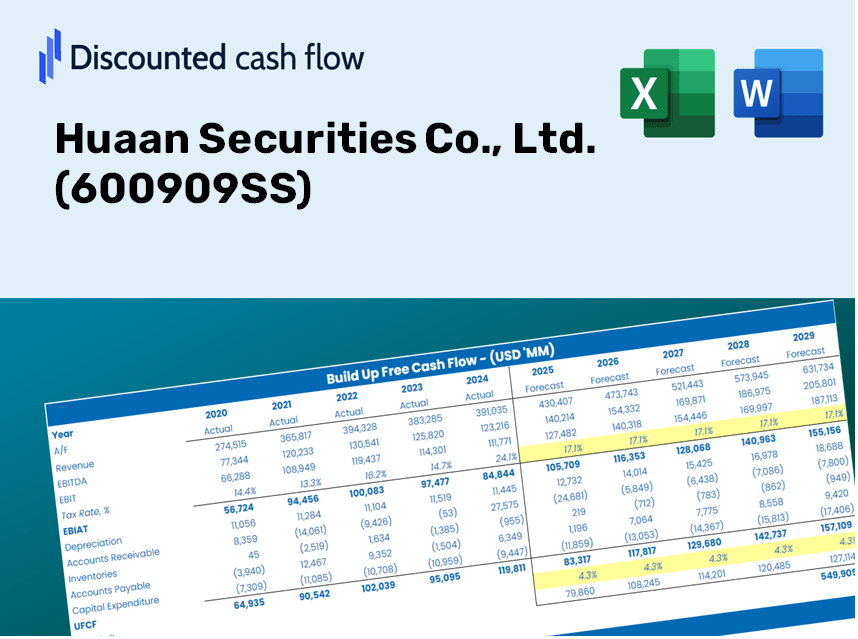
Huaan Securities Co., Ltd. (600909.SS) Bundle
¡Explore Huaan Securities Co., Ltd. (600909SS) Outlook financiero con nuestra calculadora DCF fácil de usar! Ingrese sus suposiciones para el crecimiento, los márgenes y los gastos para calcular el valor intrínseco de Huaan Securities Co., Ltd. (600909SS) y refinar su enfoque de inversión.
Discounted Cash Flow (DCF) - (USD MM)
| Year | AY1 2020 |
AY2 2021 |
AY3 2022 |
AY4 2023 |
AY5 2024 |
FY1 2025 |
FY2 2026 |
FY3 2027 |
FY4 2028 |
FY5 2029 |
|---|---|---|---|---|---|---|---|---|---|---|
| Revenue | 3,350.5 | 3,431.4 | 3,158.6 | 3,598.4 | 4,531.5 | 4,920.3 | 5,342.4 | 5,800.8 | 6,298.5 | 6,838.9 |
| Revenue Growth, % | 0 | 2.41 | -7.95 | 13.92 | 25.93 | 8.58 | 8.58 | 8.58 | 8.58 | 8.58 |
| EBITDA | 2,633.1 | 2,766.2 | 2,327.8 | 1,726.2 | .0 | 2,763.9 | 3,001.0 | 3,258.5 | 3,538.1 | 3,841.6 |
| EBITDA, % | 78.59 | 80.61 | 73.7 | 47.97 | 0 | 56.17 | 56.17 | 56.17 | 56.17 | 56.17 |
| Depreciation | 89.2 | 168.8 | 190.7 | 205.0 | 255.8 | 245.6 | 266.7 | 289.6 | 314.4 | 341.4 |
| Depreciation, % | 2.66 | 4.92 | 6.04 | 5.7 | 5.64 | 4.99 | 4.99 | 4.99 | 4.99 | 4.99 |
| EBIT | 2,543.9 | 2,597.3 | 2,137.1 | 1,521.2 | -255.8 | 2,518.3 | 2,734.3 | 2,968.9 | 3,223.7 | 3,500.2 |
| EBIT, % | 75.93 | 75.69 | 67.66 | 42.27 | -5.64 | 51.18 | 51.18 | 51.18 | 51.18 | 51.18 |
| Total Cash | 26,820.5 | 32,269.8 | 30,712.6 | 29,987.3 | 40,769.5 | 4,920.3 | 5,342.4 | 5,800.8 | 6,298.5 | 6,838.9 |
| Total Cash, percent | .0 | .0 | .0 | .0 | .0 | .0 | .0 | .0 | .0 | .0 |
| Account Receivables | 351.8 | 10,546.2 | 316.4 | 135.8 | 11,861.9 | 2,207.1 | 2,396.5 | 2,602.1 | 2,825.4 | 3,067.8 |
| Account Receivables, % | 10.5 | 307.34 | 10.02 | 3.77 | 261.77 | 44.86 | 44.86 | 44.86 | 44.86 | 44.86 |
| Inventories | 54.7 | 13,096.2 | 25.9 | .0 | .0 | 1,008.2 | 1,094.7 | 1,188.6 | 1,290.6 | 1,401.3 |
| Inventories, % | 1.63 | 381.65 | 0.81967 | 0 | 0 | 20.49 | 20.49 | 20.49 | 20.49 | 20.49 |
| Accounts Payable | 81.1 | 210.6 | 586.9 | 564.8 | 389.2 | 506.0 | 549.5 | 596.6 | 647.8 | 703.4 |
| Accounts Payable, % | 2.42 | 6.14 | 18.58 | 15.7 | 8.59 | 10.28 | 10.28 | 10.28 | 10.28 | 10.28 |
| Capital Expenditure | -505.9 | -229.0 | -294.5 | -327.7 | -178.0 | -434.3 | -471.6 | -512.0 | -555.9 | -603.6 |
| Capital Expenditure, % | -15.1 | -6.67 | -9.32 | -9.11 | -3.93 | -8.83 | -8.83 | -8.83 | -8.83 | -8.83 |
| Tax Rate, % | 15.34 | 15.34 | 15.34 | 15.34 | 15.34 | 15.34 | 15.34 | 15.34 | 15.34 | 15.34 |
| EBITAT | 1,977.0 | 2,069.9 | 1,845.9 | 1,274.4 | -216.5 | 2,076.1 | 2,254.3 | 2,447.7 | 2,657.7 | 2,885.7 |
| Depreciation | ||||||||||
| Changes in Account Receivables | ||||||||||
| Changes in Inventories | ||||||||||
| Changes in Accounts Payable | ||||||||||
| Capital Expenditure | ||||||||||
| UFCF | 1,234.9 | -21,096.7 | 25,418.4 | 1,336.1 | -12,040.4 | 10,650.9 | 1,817.0 | 1,972.8 | 2,142.1 | 2,325.9 |
| WACC, % | 4.28 | 4.32 | 4.47 | 4.41 | 4.43 | 4.38 | 4.38 | 4.38 | 4.38 | 4.38 |
| PV UFCF | ||||||||||
| SUM PV UFCF | 17,287.1 | |||||||||
| Long Term Growth Rate, % | 2.00 | |||||||||
| Free cash flow (T + 1) | 2,372 | |||||||||
| Terminal Value | 99,555 | |||||||||
| Present Terminal Value | 80,337 | |||||||||
| Enterprise Value | 97,624 | |||||||||
| Net Debt | 50,049 | |||||||||
| Equity Value | 47,575 | |||||||||
| Diluted Shares Outstanding, MM | 4,952 | |||||||||
| Equity Value Per Share | 9.61 |
What You Will Receive
- Genuine Huaan Data: Comprehensive financial information – encompassing revenue to EBIT – derived from actual and projected metrics.
- Complete Customization: Modify all essential parameters (yellow cells) such as WACC, growth %, and tax rates to suit your analysis.
- Instant Valuation Adjustments: Automated recalculations to assess the effects of changes on the fair value of Huaan Securities (600909SS).
- Flexible Excel Template: Designed for quick modifications, scenario analysis, and in-depth forecasting.
- Efficient and Precise: Eliminate the need to construct models from the ground up while ensuring accuracy and adaptability.
Key Features
- Customizable Investment Parameters: Adjust essential factors such as revenue growth, net profit margin, and capital investments.
- Instant DCF Valuation: Quickly computes intrinsic value, NPV, and other key metrics.
- High Precision Analyses: Leverages Huaan Securities' actual financial data for accurate valuation results.
- Simplified Scenario Testing: Easily explore various assumptions and evaluate different results.
- Efficiency Booster: Streamlines the process by removing the need for complex valuation models from the ground up.
How It Functions
- Download the Template: Obtain immediate access to the Excel-based HUAAN DCF Calculator.
- Input Your Assumptions: Modify the yellow-highlighted cells for growth rates, WACC, profit margins, and other variables.
- Instant Calculations: The model automatically recalculates the intrinsic value of Huaan Securities (600909SS).
- Test Scenarios: Experiment with various assumptions to assess potential changes in valuation.
- Analyze and Decide: Utilize the results to inform your investment decisions or financial evaluations.
Why Opt for Huaan Securities Co., Ltd. (600909SS)?
- Precise Information: Up-to-date financial data guarantees dependable valuation outcomes.
- Flexible Settings: Tailor essential inputs such as growth rates, WACC, and tax rates to align with your forecasts.
- Efficient: Ready-made calculations save you the hassle of building from the ground up.
- Professional-Quality Tool: Crafted for investors, analysts, and financial consultants.
- User-Friendly Interface: Designed with an intuitive layout and straightforward instructions for users of all skill levels.
Who Should Utilize Huaan Securities Co., Ltd. (600909SS)?
- Finance Students: Master investment strategies and apply them using real market data.
- Academics: Integrate advanced financial models into your research and educational materials.
- Investors: Challenge your investment strategies and evaluate valuation metrics for Huaan Securities (600909SS).
- Analysts: Enhance your analysis process with a customizable financial modeling framework.
- Small Business Owners: Understand the analytical methods used to assess large public entities like Huaan Securities (600909SS).
Contents of the Template
- Pre-Populated Data: Contains Huaan Securities Co., Ltd. (600909SS) historical financials and projections.
- Discounted Cash Flow Model: An editable DCF valuation model featuring automatic calculations.
- Weighted Average Cost of Capital (WACC): A specific sheet for computing WACC based on user-defined inputs.
- Essential Financial Ratios: Evaluate Huaan Securities' profitability, operational efficiency, and financial leverage.
- Adjustable Inputs: Easily modify revenue growth rates, profit margins, and tax rates.
- User-Friendly Dashboard: Visual representations and tables that summarize the key valuation outcomes.
Disclaimer
All information, articles, and product details provided on this website are for general informational and educational purposes only. We do not claim any ownership over, nor do we intend to infringe upon, any trademarks, copyrights, logos, brand names, or other intellectual property mentioned or depicted on this site. Such intellectual property remains the property of its respective owners, and any references here are made solely for identification or informational purposes, without implying any affiliation, endorsement, or partnership.
We make no representations or warranties, express or implied, regarding the accuracy, completeness, or suitability of any content or products presented. Nothing on this website should be construed as legal, tax, investment, financial, medical, or other professional advice. In addition, no part of this site—including articles or product references—constitutes a solicitation, recommendation, endorsement, advertisement, or offer to buy or sell any securities, franchises, or other financial instruments, particularly in jurisdictions where such activity would be unlawful.
All content is of a general nature and may not address the specific circumstances of any individual or entity. It is not a substitute for professional advice or services. Any actions you take based on the information provided here are strictly at your own risk. You accept full responsibility for any decisions or outcomes arising from your use of this website and agree to release us from any liability in connection with your use of, or reliance upon, the content or products found herein.