
|
Baosheng Science and Technology Innovation Co., Ltd. (600973.ss) Valoración de DCF |
Completamente Editable: Adáptelo A Sus Necesidades En Excel O Sheets
Diseño Profesional: Plantillas Confiables Y Estándares De La Industria
Predeterminadas Para Un Uso Rápido Y Eficiente
Compatible con MAC / PC, completamente desbloqueado
No Se Necesita Experiencia; Fáciles De Seguir
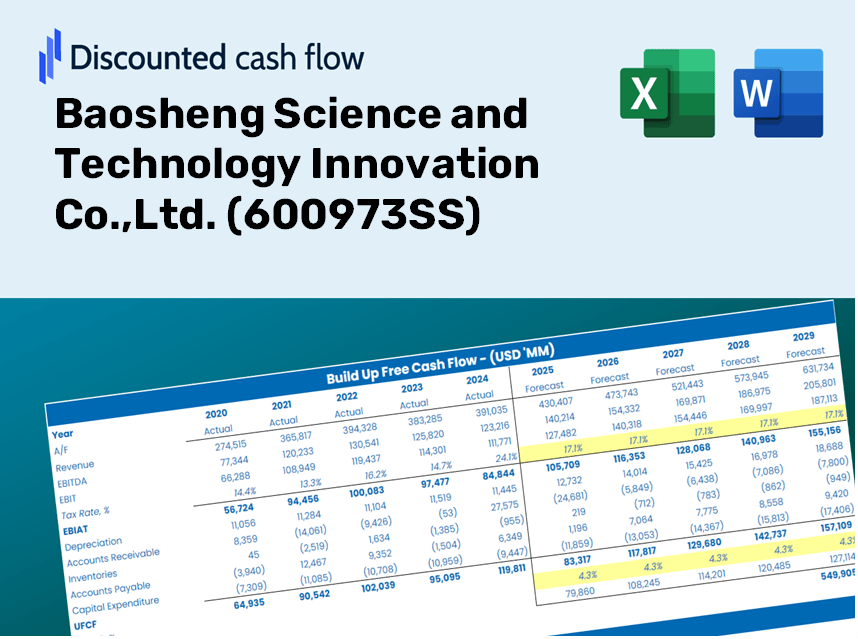
Baosheng Science and Technology Innovation Co.,Ltd. (600973.SS) Bundle
¡Explore las perspectivas financieras de Baosheng Science and Technology Innovation Co., Ltd. (600973SS) con nuestra calculadora DCF fácil de usar! Ingrese sus proyecciones para el crecimiento, los márgenes y los gastos para calcular el valor intrínseco de Baosheng Science and Technology Innovation Co., Ltd. (600973SS) y refinar su enfoque de inversión.
Discounted Cash Flow (DCF) - (USD MM)
| Year | AY1 2020 |
AY2 2021 |
AY3 2022 |
AY4 2023 |
AY5 2024 |
FY1 2025 |
FY2 2026 |
FY3 2027 |
FY4 2028 |
FY5 2029 |
|---|---|---|---|---|---|---|---|---|---|---|
| Revenue | 34,284.2 | 42,989.2 | 41,481.6 | 43,798.3 | 46,360.0 | 50,858.7 | 55,793.9 | 61,207.9 | 67,147.4 | 73,663.2 |
| Revenue Growth, % | 0 | 25.39 | -3.51 | 5.59 | 5.85 | 9.7 | 9.7 | 9.7 | 9.7 | 9.7 |
| EBITDA | 1,203.6 | 1,310.3 | 969.0 | 1,078.4 | 553.4 | 1,276.6 | 1,400.5 | 1,536.4 | 1,685.5 | 1,849.0 |
| EBITDA, % | 3.51 | 3.05 | 2.34 | 2.46 | 1.19 | 2.51 | 2.51 | 2.51 | 2.51 | 2.51 |
| Depreciation | 407.0 | 456.7 | 504.2 | 543.8 | 575.9 | 605.1 | 663.8 | 728.2 | 798.9 | 876.4 |
| Depreciation, % | 1.19 | 1.06 | 1.22 | 1.24 | 1.24 | 1.19 | 1.19 | 1.19 | 1.19 | 1.19 |
| EBIT | 796.6 | 853.6 | 464.8 | 534.6 | -22.5 | 671.5 | 736.7 | 808.2 | 886.6 | 972.6 |
| EBIT, % | 2.32 | 1.99 | 1.12 | 1.22 | -0.04848381 | 1.32 | 1.32 | 1.32 | 1.32 | 1.32 |
| Total Cash | 3,574.9 | 3,821.9 | 3,883.6 | 3,755.3 | 2,832.9 | 4,410.9 | 4,838.9 | 5,308.5 | 5,823.6 | 6,388.7 |
| Total Cash, percent | .0 | .0 | .0 | .0 | .0 | .0 | .0 | .0 | .0 | .0 |
| Account Receivables | 7,007.1 | 5,963.1 | 6,488.3 | 6,889.3 | 7,337.9 | 8,290.8 | 9,095.4 | 9,978.0 | 10,946.2 | 12,008.4 |
| Account Receivables, % | 20.44 | 13.87 | 15.64 | 15.73 | 15.83 | 16.3 | 16.3 | 16.3 | 16.3 | 16.3 |
| Inventories | 2,459.0 | 2,730.1 | 2,613.2 | 3,432.3 | 3,337.1 | 3,545.6 | 3,889.7 | 4,267.1 | 4,681.2 | 5,135.5 |
| Inventories, % | 7.17 | 6.35 | 6.3 | 7.84 | 7.2 | 6.97 | 6.97 | 6.97 | 6.97 | 6.97 |
| Accounts Payable | 1,600.6 | 1,209.7 | 1,303.1 | 1,539.1 | 3,037.8 | 2,104.6 | 2,308.8 | 2,532.9 | 2,778.6 | 3,048.3 |
| Accounts Payable, % | 4.67 | 2.81 | 3.14 | 3.51 | 6.55 | 4.14 | 4.14 | 4.14 | 4.14 | 4.14 |
| Capital Expenditure | -1,091.2 | -667.5 | -456.7 | -544.8 | -292.8 | -784.4 | -860.5 | -944.0 | -1,035.6 | -1,136.1 |
| Capital Expenditure, % | -3.18 | -1.55 | -1.1 | -1.24 | -0.63163 | -1.54 | -1.54 | -1.54 | -1.54 | -1.54 |
| Tax Rate, % | 16.53 | 16.53 | 16.53 | 16.53 | 16.53 | 16.53 | 16.53 | 16.53 | 16.53 | 16.53 |
| EBITAT | 529.5 | 923.5 | 323.6 | 301.2 | -18.8 | 504.8 | 553.8 | 607.6 | 666.5 | 731.2 |
| Depreciation | ||||||||||
| Changes in Account Receivables | ||||||||||
| Changes in Inventories | ||||||||||
| Changes in Accounts Payable | ||||||||||
| Capital Expenditure | ||||||||||
| UFCF | -8,020.3 | 1,094.7 | 56.3 | -683.8 | 1,409.6 | -1,769.2 | -587.2 | -644.2 | -706.7 | -775.3 |
| WACC, % | 3.78 | 4.74 | 3.87 | 3.49 | 4.27 | 4.03 | 4.03 | 4.03 | 4.03 | 4.03 |
| PV UFCF | ||||||||||
| SUM PV UFCF | -4,055.2 | |||||||||
| Long Term Growth Rate, % | 3.50 | |||||||||
| Free cash flow (T + 1) | -802 | |||||||||
| Terminal Value | -150,907 | |||||||||
| Present Terminal Value | -123,846 | |||||||||
| Enterprise Value | -127,901 | |||||||||
| Net Debt | 7,104 | |||||||||
| Equity Value | -135,005 | |||||||||
| Diluted Shares Outstanding, MM | 1,371 | |||||||||
| Equity Value Per Share | -98.45 |
What You Will Receive
- Customizable Excel Template: A fully adaptable Excel-based DCF Calculator featuring pre-filled financial data for Baosheng Science and Technology Innovation Co., Ltd. (600973SS).
- Comprehensive Data: Access to historical figures and forward-looking projections (highlighted in the yellow cells).
- Adjustable Forecasts: Modify assumptions regarding revenue growth, EBITDA margins, and WACC as needed.
- Instant Calculations: Quickly assess how your inputs affect the valuation of Baosheng Science and Technology Innovation Co., Ltd. (600973SS).
- Professional Resource: Designed for investors, CFOs, consultants, and financial analysts looking for detailed insights.
- Intuitive Layout: Organized for clarity and user-friendliness, complete with step-by-step guidance.
Key Features
- Authentic Baosheng Data: Pre-loaded with Baosheng Science and Technology Innovation Co., Ltd.'s historical financials and future projections.
- Customizable Parameters: Tailor revenue growth, profit margins, WACC, tax rates, and capital expenditures to your needs.
- Interactive Valuation Tool: Automatically recalculates Net Present Value (NPV) and intrinsic value based on the parameters you set.
- Forecast Scenario Analysis: Generate various scenarios to evaluate different valuation possibilities.
- User-Friendly Interface: Designed with simplicity and clarity in mind, suitable for both experts and newcomers.
How It Functions
- Download the Template: Gain immediate access to the Excel-based Baosheng Science and Technology Innovation DCF Calculator.
- Input Your Assumptions: Modify the yellow-highlighted cells for growth projections, WACC, profit margins, and more.
- Instant Calculations: The model automatically recalculates the intrinsic value of Baosheng Science and Technology Innovation Co., Ltd. (600973SS).
- Test Scenarios: Simulate various assumptions to assess potential changes in valuation.
- Analyze and Decide: Utilize the results to inform your investment or financial decisions.
Why Opt for This Calculator for Baosheng Science and Technology Innovation Co., Ltd. (600973SS)?
- Accurate Data: Utilizes real Baosheng financial metrics to provide trustworthy valuation outcomes.
- Customizable: Tailor essential variables such as growth rates, WACC, and tax rates to align with your forecasts.
- Time-Saving: Ready-made calculations mean you don’t have to start from ground zero.
- Professional-Grade Tool: Engineered for investors, analysts, and consultants alike.
- User-Friendly: Simple interface and detailed instructions ensure accessibility for all users.
Who Can Benefit from Baosheng Science and Technology Innovation Co., Ltd. (600973SS)?
- Investors: Make informed investment choices with a sophisticated valuation tool tailored for Baosheng.
- Financial Analysts: Enhance efficiency with a customizable DCF model designed specifically for Baosheng's financial landscape.
- Consultants: Easily modify the template for impactful client presentations or reports focused on Baosheng.
- Finance Enthusiasts: Expand your knowledge of valuation methods through practical examples related to Baosheng’s market position.
- Educators and Students: Utilize it as an effective hands-on resource in finance courses discussing Baosheng's performance.
What the Template Includes
- In-Depth DCF Model: An editable template featuring comprehensive valuation computations.
- Actual Financial Data: Baosheng Science and Technology Innovation Co., Ltd.'s historical and projected financials preloaded for in-depth analysis.
- Customizable Assumptions: Modify WACC, growth rates, and tax parameters to explore various scenarios.
- Complete Financial Statements: Detailed annual and quarterly reports for enhanced understanding.
- Essential Ratios: Integrated analysis for profitability, efficiency, and leverage metrics.
- Interactive Dashboard with Visual Insights: Graphs and tables that present clear and actionable outcomes.
Disclaimer
All information, articles, and product details provided on this website are for general informational and educational purposes only. We do not claim any ownership over, nor do we intend to infringe upon, any trademarks, copyrights, logos, brand names, or other intellectual property mentioned or depicted on this site. Such intellectual property remains the property of its respective owners, and any references here are made solely for identification or informational purposes, without implying any affiliation, endorsement, or partnership.
We make no representations or warranties, express or implied, regarding the accuracy, completeness, or suitability of any content or products presented. Nothing on this website should be construed as legal, tax, investment, financial, medical, or other professional advice. In addition, no part of this site—including articles or product references—constitutes a solicitation, recommendation, endorsement, advertisement, or offer to buy or sell any securities, franchises, or other financial instruments, particularly in jurisdictions where such activity would be unlawful.
All content is of a general nature and may not address the specific circumstances of any individual or entity. It is not a substitute for professional advice or services. Any actions you take based on the information provided here are strictly at your own risk. You accept full responsibility for any decisions or outcomes arising from your use of this website and agree to release us from any liability in connection with your use of, or reliance upon, the content or products found herein.