
|
Sichuan Guangan Aaapublic Co., Ltd (600979.SS) Valoración de DCF |
Completamente Editable: Adáptelo A Sus Necesidades En Excel O Sheets
Diseño Profesional: Plantillas Confiables Y Estándares De La Industria
Predeterminadas Para Un Uso Rápido Y Eficiente
Compatible con MAC / PC, completamente desbloqueado
No Se Necesita Experiencia; Fáciles De Seguir
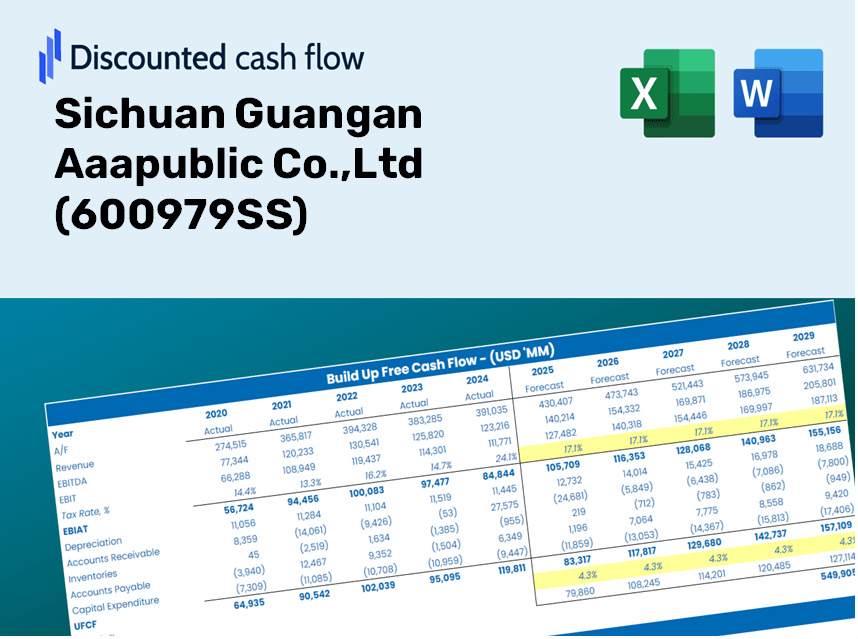
Sichuan Guangan Aaapublic Co.,Ltd (600979.SS) Bundle
¡Ahorre tiempo y mejore la precisión con nuestra calculadora DCF (600979SS)! Utilizando datos reales de Sichuan Guangan Aaapublic Co., LTD y permitiendo supuestos personalizables, esta herramienta le permite pronosticar, analizar y valor (600979SS) como un inversor experimentado.
Discounted Cash Flow (DCF) - (USD MM)
| Year | AY1 2020 |
AY2 2021 |
AY3 2022 |
AY4 2023 |
AY5 2024 |
FY1 2025 |
FY2 2026 |
FY3 2027 |
FY4 2028 |
FY5 2029 |
|---|---|---|---|---|---|---|---|---|---|---|
| Revenue | 2,269.2 | 2,394.0 | 2,582.0 | 2,827.8 | 3,214.6 | 3,508.4 | 3,829.0 | 4,178.9 | 4,560.7 | 4,977.5 |
| Revenue Growth, % | 0 | 5.5 | 7.85 | 9.52 | 13.68 | 9.14 | 9.14 | 9.14 | 9.14 | 9.14 |
| EBITDA | 678.2 | 699.6 | 698.9 | 762.7 | 821.5 | 973.3 | 1,062.2 | 1,159.2 | 1,265.2 | 1,380.8 |
| EBITDA, % | 29.88 | 29.22 | 27.07 | 26.97 | 25.55 | 27.74 | 27.74 | 27.74 | 27.74 | 27.74 |
| Depreciation | 299.8 | 321.4 | 339.5 | 356.3 | 384.1 | 451.4 | 492.7 | 537.7 | 586.8 | 640.5 |
| Depreciation, % | 13.21 | 13.42 | 13.15 | 12.6 | 11.95 | 12.87 | 12.87 | 12.87 | 12.87 | 12.87 |
| EBIT | 378.3 | 378.3 | 359.4 | 406.3 | 437.4 | 521.8 | 569.5 | 621.6 | 678.3 | 740.3 |
| EBIT, % | 16.67 | 15.8 | 13.92 | 14.37 | 13.61 | 14.87 | 14.87 | 14.87 | 14.87 | 14.87 |
| Total Cash | 729.2 | 515.2 | 899.6 | 602.8 | 531.4 | 886.5 | 967.5 | 1,055.9 | 1,152.4 | 1,257.7 |
| Total Cash, percent | .0 | .0 | .0 | .0 | .0 | .0 | .0 | .0 | .0 | .0 |
| Account Receivables | 263.9 | 354.9 | 485.9 | 623.6 | 907.9 | 670.6 | 731.9 | 798.7 | 871.7 | 951.4 |
| Account Receivables, % | 11.63 | 14.82 | 18.82 | 22.05 | 28.24 | 19.11 | 19.11 | 19.11 | 19.11 | 19.11 |
| Inventories | 121.5 | 130.4 | 76.1 | 88.8 | 115.1 | 143.6 | 156.7 | 171.1 | 186.7 | 203.8 |
| Inventories, % | 5.35 | 5.45 | 2.95 | 3.14 | 3.58 | 4.09 | 4.09 | 4.09 | 4.09 | 4.09 |
| Accounts Payable | 387.6 | 359.7 | 433.8 | 569.3 | 758.0 | 649.9 | 709.3 | 774.1 | 844.9 | 922.1 |
| Accounts Payable, % | 17.08 | 15.03 | 16.8 | 20.13 | 23.58 | 18.52 | 18.52 | 18.52 | 18.52 | 18.52 |
| Capital Expenditure | -420.0 | -405.7 | -471.0 | -553.2 | -410.3 | -603.6 | -658.8 | -719.0 | -784.6 | -856.3 |
| Capital Expenditure, % | -18.51 | -16.95 | -18.24 | -19.56 | -12.76 | -17.2 | -17.2 | -17.2 | -17.2 | -17.2 |
| Tax Rate, % | 26.29 | 26.29 | 26.29 | 26.29 | 26.29 | 26.29 | 26.29 | 26.29 | 26.29 | 26.29 |
| EBITAT | 294.4 | 310.6 | 266.9 | 322.4 | 322.4 | 404.2 | 441.1 | 481.4 | 525.4 | 573.4 |
| Depreciation | ||||||||||
| Changes in Account Receivables | ||||||||||
| Changes in Inventories | ||||||||||
| Changes in Accounts Payable | ||||||||||
| Capital Expenditure | ||||||||||
| UFCF | 176.5 | 98.5 | 132.9 | 110.6 | 174.4 | 352.7 | 260.0 | 283.8 | 309.7 | 338.0 |
| WACC, % | 4.35 | 4.42 | 4.3 | 4.38 | 4.3 | 4.35 | 4.35 | 4.35 | 4.35 | 4.35 |
| PV UFCF | ||||||||||
| SUM PV UFCF | 1,361.0 | |||||||||
| Long Term Growth Rate, % | 3.50 | |||||||||
| Free cash flow (T + 1) | 350 | |||||||||
| Terminal Value | 41,183 | |||||||||
| Present Terminal Value | 33,286 | |||||||||
| Enterprise Value | 34,647 | |||||||||
| Net Debt | 2,036 | |||||||||
| Equity Value | 32,611 | |||||||||
| Diluted Shares Outstanding, MM | 1,245 | |||||||||
| Equity Value Per Share | 26.20 |
What You Will Receive
- Customizable Excel Template: A fully adjustable Excel-based DCF Calculator featuring pre-filled financial data from Sichuan Guangan Aaapublic Co.,Ltd (600979SS).
- Comprehensive Data: Historical performance metrics and future estimates (highlighted in the yellow cells).
- Flexible Forecasting: Modify assumptions for revenue growth, EBITDA percentage, and WACC as desired.
- Instant Calculations: Quickly assess how your inputs affect the valuation of Sichuan Guangan Aaapublic Co.,Ltd (600979SS).
- Professional Grade Tool: Designed specifically for investors, CFOs, consultants, and financial analysts.
- User-Friendly Interface: Organized for simplicity and convenience, complete with step-by-step guidance.
Key Features
- Comprehensive Financial Data: Access Sichuan Guangan Aaapublic Co.,Ltd's historical financial statements and detailed projections.
- Customizable Variables: Adjust WACC, tax rates, revenue growth, and EBITDA margins to fit your analysis.
- Real-Time Updates: Monitor the recalculating intrinsic value of Sichuan Guangan Aaapublic Co.,Ltd in an instant.
- Intuitive Visualizations: Utilize dashboard charts to view valuation outcomes and critical metrics effortlessly.
- Designed for Precision: A trusted tool for analysts, investors, and finance professionals.
How It Operates
- 1. Access the Template: Download and open the Excel file featuring Sichuan Guangan Aaapublic Co.,Ltd's preloaded data.
- 2. Modify Assumptions: Adjust key inputs such as growth rates, WACC, and capital expenditures to fit your analysis.
- 3. View Results in Real-Time: The DCF model automatically calculates intrinsic value and NPV based on your inputs.
- 4. Explore Scenarios: Evaluate various forecasts to assess different valuation outcomes for (600979SS).
- 5. Utilize with Assurance: Present comprehensive valuation insights to bolster your strategic decisions.
Reasons to Choose Sichuan Guangan Aaapublic Co., Ltd (600979SS)
- Time Efficiency: Skip the hassle of building financial models from the ground up – our tools are instantly ready for use.
- Enhanced Precision: Dependable financial data and formulas minimize valuation discrepancies.
- Completely Customizable: Adjust the model to align with your unique assumptions and forecasts.
- User-Friendly Interface: Intuitive charts and outputs simplify data interpretation.
- Preferred by Professionals: Crafted for experts who prioritize accuracy and functionality.
Who Should Use This Product?
- Individual Investors: Make informed choices regarding the buying or selling of Sichuan Guangan Aaapublic Co.,Ltd (600979SS) stock.
- Financial Analysts: Enhance valuation processes with ready-to-implement financial models tailored for Sichuan Guangan Aaapublic Co.,Ltd (600979SS).
- Consultants: Provide clients with timely and accurate valuation insights on Sichuan Guangan Aaapublic Co.,Ltd (600979SS).
- Business Owners: Gain insights into the valuation of prominent companies like Sichuan Guangan Aaapublic Co.,Ltd (600979SS) to inform your own business strategy.
- Finance Students: Master valuation techniques through the analysis of real-world data and case studies involving Sichuan Guangan Aaapublic Co.,Ltd (600979SS).
What the Template Includes
- Pre-Filled DCF Model: Sichuan Guangan Aaapublic Co.,Ltd's financial data preloaded for immediate analysis.
- WACC Calculator: Comprehensive calculations for the Weighted Average Cost of Capital.
- Financial Ratios: Assess Sichuan Guangan Aaapublic Co.,Ltd's profitability, leverage, and efficiency metrics.
- Editable Inputs: Adjust assumptions like growth rates, profit margins, and capital expenditures to align with your scenarios.
- Financial Statements: Annual and quarterly reports provided for in-depth analysis.
- Interactive Dashboard: Effortlessly visualize essential valuation metrics and outcomes.
Disclaimer
All information, articles, and product details provided on this website are for general informational and educational purposes only. We do not claim any ownership over, nor do we intend to infringe upon, any trademarks, copyrights, logos, brand names, or other intellectual property mentioned or depicted on this site. Such intellectual property remains the property of its respective owners, and any references here are made solely for identification or informational purposes, without implying any affiliation, endorsement, or partnership.
We make no representations or warranties, express or implied, regarding the accuracy, completeness, or suitability of any content or products presented. Nothing on this website should be construed as legal, tax, investment, financial, medical, or other professional advice. In addition, no part of this site—including articles or product references—constitutes a solicitation, recommendation, endorsement, advertisement, or offer to buy or sell any securities, franchises, or other financial instruments, particularly in jurisdictions where such activity would be unlawful.
All content is of a general nature and may not address the specific circumstances of any individual or entity. It is not a substitute for professional advice or services. Any actions you take based on the information provided here are strictly at your own risk. You accept full responsibility for any decisions or outcomes arising from your use of this website and agree to release us from any liability in connection with your use of, or reliance upon, the content or products found herein.