
|
Tangshan Port Group Co., Ltd (601000.SS) Valoración de DCF |
Completamente Editable: Adáptelo A Sus Necesidades En Excel O Sheets
Diseño Profesional: Plantillas Confiables Y Estándares De La Industria
Predeterminadas Para Un Uso Rápido Y Eficiente
Compatible con MAC / PC, completamente desbloqueado
No Se Necesita Experiencia; Fáciles De Seguir
TangShan Port Group Co.,Ltd (601000.SS) Bundle
¡Descubra el verdadero potencial de Tangshan Port Group Co., Ltd (601000SS) con nuestra calculadora DCF avanzada! Ajuste los supuestos clave, explore varios escenarios y evalúe cómo los cambios afectan a Tangshan Port Group Co., Valoración LTD (601000SS), todo convenientemente empaquetado en una plantilla de Excel.
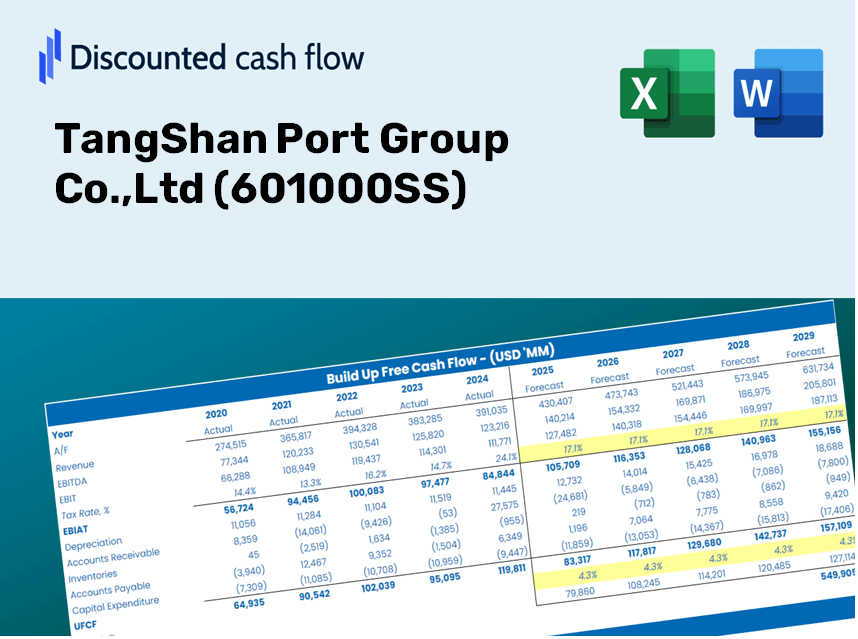
Discounted Cash Flow (DCF) - (USD MM)
| Year | AY1 2020 |
AY2 2021 |
AY3 2022 |
AY4 2023 |
AY5 2024 |
FY1 2025 |
FY2 2026 |
FY3 2027 |
FY4 2028 |
FY5 2029 |
|---|---|---|---|---|---|---|---|---|---|---|
| Revenue | 7,837.3 | 6,075.0 | 5,619.9 | 5,844.6 | 5,724.3 | 5,323.1 | 4,950.0 | 4,603.1 | 4,280.4 | 3,980.4 |
| Revenue Growth, % | 0 | -22.49 | -7.49 | 4 | -2.06 | -7.01 | -7.01 | -7.01 | -7.01 | -7.01 |
| EBITDA | 2,773.4 | 2,573.0 | 2,365.6 | 2,726.8 | 2,691.5 | 2,273.1 | 2,113.7 | 1,965.6 | 1,827.8 | 1,699.7 |
| EBITDA, % | 35.39 | 42.35 | 42.09 | 46.65 | 47.02 | 42.7 | 42.7 | 42.7 | 42.7 | 42.7 |
| Depreciation | 927.0 | 870.6 | 723.8 | 733.3 | 725.4 | 684.1 | 636.1 | 591.6 | 550.1 | 511.5 |
| Depreciation, % | 11.83 | 14.33 | 12.88 | 12.55 | 12.67 | 12.85 | 12.85 | 12.85 | 12.85 | 12.85 |
| EBIT | 1,846.4 | 1,702.4 | 1,641.9 | 1,993.5 | 1,966.1 | 1,589.0 | 1,477.6 | 1,374.0 | 1,277.7 | 1,188.2 |
| EBIT, % | 23.56 | 28.02 | 29.22 | 34.11 | 34.35 | 29.85 | 29.85 | 29.85 | 29.85 | 29.85 |
| Total Cash | 5,118.4 | 5,297.0 | 6,775.0 | 5,614.5 | 4,789.9 | 4,601.7 | 4,279.2 | 3,979.3 | 3,700.4 | 3,441.0 |
| Total Cash, percent | .0 | .0 | .0 | .0 | .0 | .0 | .0 | .0 | .0 | .0 |
| Account Receivables | 1,492.3 | 3,172.1 | 1,141.3 | 839.8 | 657.0 | 1,250.0 | 1,162.4 | 1,080.9 | 1,005.1 | 934.7 |
| Account Receivables, % | 19.04 | 52.21 | 20.31 | 14.37 | 11.48 | 23.48 | 23.48 | 23.48 | 23.48 | 23.48 |
| Inventories | 218.0 | 105.5 | 103.5 | 87.1 | 86.3 | 99.6 | 92.7 | 86.2 | 80.1 | 74.5 |
| Inventories, % | 2.78 | 1.74 | 1.84 | 1.49 | 1.51 | 1.87 | 1.87 | 1.87 | 1.87 | 1.87 |
| Accounts Payable | 1,999.5 | 1,259.0 | 1,237.3 | 884.4 | 946.5 | 1,063.8 | 989.2 | 919.9 | 855.4 | 795.4 |
| Accounts Payable, % | 25.51 | 20.72 | 22.02 | 15.13 | 16.53 | 19.98 | 19.98 | 19.98 | 19.98 | 19.98 |
| Capital Expenditure | -357.5 | -765.5 | -571.4 | -336.5 | -630.0 | -469.4 | -436.5 | -405.9 | -377.5 | -351.0 |
| Capital Expenditure, % | -4.56 | -12.6 | -10.17 | -5.76 | -11.01 | -8.82 | -8.82 | -8.82 | -8.82 | -8.82 |
| Tax Rate, % | 26.26 | 26.26 | 26.26 | 26.26 | 26.26 | 26.26 | 26.26 | 26.26 | 26.26 | 26.26 |
| EBITAT | 1,430.6 | 1,371.4 | 1,228.4 | 1,488.5 | 1,449.8 | 1,211.6 | 1,126.7 | 1,047.7 | 974.3 | 906.0 |
| Depreciation | ||||||||||
| Changes in Account Receivables | ||||||||||
| Changes in Inventories | ||||||||||
| Changes in Accounts Payable | ||||||||||
| Capital Expenditure | ||||||||||
| UFCF | 2,289.2 | -831.2 | 3,391.9 | 1,850.3 | 1,790.8 | 937.3 | 1,346.3 | 1,252.0 | 1,164.2 | 1,082.6 |
| WACC, % | 5.42 | 5.42 | 5.42 | 5.42 | 5.42 | 5.42 | 5.42 | 5.42 | 5.42 | 5.42 |
| PV UFCF | ||||||||||
| SUM PV UFCF | 4,943.2 | |||||||||
| Long Term Growth Rate, % | 1.00 | |||||||||
| Free cash flow (T + 1) | 1,093 | |||||||||
| Terminal Value | 24,734 | |||||||||
| Present Terminal Value | 18,996 | |||||||||
| Enterprise Value | 23,940 | |||||||||
| Net Debt | -4,790 | |||||||||
| Equity Value | 28,729 | |||||||||
| Diluted Shares Outstanding, MM | 5,926 | |||||||||
| Equity Value Per Share | 4.85 |
What You Will Receive
- Authentic TS Port Financial Data: Pre-loaded with TangShan Port Group’s historical and forecasted data for accurate assessments.
- Completely Customizable Template: Easily adjust key inputs such as revenue growth rates, WACC, and EBITDA percentages.
- Instant Calculations: Observe the real-time update of TangShan Port’s intrinsic value based on your modifications.
- Expert Valuation Tool: Tailored for investors, analysts, and consultants aiming for reliable DCF outcomes.
- User-Centric Design: Intuitive layout and clear guidance suitable for all skill levels.
Key Features
- Comprehensive TPG Data: Pre-loaded with TangShan Port Group Co., Ltd's historical financial figures and future forecasts.
- Flexible Input Options: Tailor revenue growth, profit margins, WACC, tax rates, and capital expenditures as needed.
- Dynamic Valuation Model: Instantaneous updates to Net Present Value (NPV) and intrinsic value based on your specified inputs.
- Scenario Analysis: Develop various forecast scenarios to evaluate different valuation possibilities.
- User-Friendly Interface: Intuitive, organized, and suitable for both industry professionals and newcomers.
How It Functions
- Download: Obtain the comprehensive Excel file containing TangShan Port Group Co.,Ltd's financial data.
- Customize: Modify projections, such as revenue growth, EBITDA %, and WACC.
- Update Automatically: Intrinsic value and NPV calculations refresh in real-time.
- Test Scenarios: Generate various forecasts and instantly compare results.
- Make Decisions: Leverage the valuation findings to shape your investment approach.
Why Choose TangShan Port Group Co., Ltd (601000SS) Calculator?
- Time-Saving: Utilize a pre-built model without starting from scratch – it’s ready for immediate use.
- Enhanced Accuracy: Dependable financial data and formulas minimize valuation errors.
- Completely Customizable: Adapt the model to suit your specific assumptions and forecasts.
- User-Friendly: Intuitive charts and outputs simplify result analysis.
- Endorsed by Professionals: Crafted for experts who prioritize both precision and functionality.
Who Should Utilize This Product?
- Investors: Evaluate TangShan Port Group’s valuation prior to trading stocks.
- CFOs and Financial Analysts: Enhance valuation processes and assess financial forecasts.
- Startup Founders: Understand the valuation methods used for established companies like TangShan Port Group (601000SS).
- Consultants: Provide expert valuation analyses for clients in need.
- Students and Educators: Apply real-world data to master and teach valuation strategies.
Contents of the Template
- Historical Data: Contains TangShan Port Group Co., Ltd's (601000SS) previous financial performance and baseline projections.
- DCF and Levered DCF Models: Comprehensive templates for determining the intrinsic value of TangShan Port Group Co., Ltd (601000SS).
- WACC Sheet: Pre-configured calculations for Weighted Average Cost of Capital.
- Editable Inputs: Adjust critical variables such as growth rates, EBITDA percentages, and CAPEX estimates.
- Quarterly and Annual Statements: A thorough analysis of TangShan Port Group Co., Ltd's (601000SS) financials.
- Interactive Dashboard: Dynamically visualize valuation outcomes and forecasts.
Disclaimer
All information, articles, and product details provided on this website are for general informational and educational purposes only. We do not claim any ownership over, nor do we intend to infringe upon, any trademarks, copyrights, logos, brand names, or other intellectual property mentioned or depicted on this site. Such intellectual property remains the property of its respective owners, and any references here are made solely for identification or informational purposes, without implying any affiliation, endorsement, or partnership.
We make no representations or warranties, express or implied, regarding the accuracy, completeness, or suitability of any content or products presented. Nothing on this website should be construed as legal, tax, investment, financial, medical, or other professional advice. In addition, no part of this site—including articles or product references—constitutes a solicitation, recommendation, endorsement, advertisement, or offer to buy or sell any securities, franchises, or other financial instruments, particularly in jurisdictions where such activity would be unlawful.
All content is of a general nature and may not address the specific circumstances of any individual or entity. It is not a substitute for professional advice or services. Any actions you take based on the information provided here are strictly at your own risk. You accept full responsibility for any decisions or outcomes arising from your use of this website and agree to release us from any liability in connection with your use of, or reliance upon, the content or products found herein.