
|
Shandong Publishing & Media Co., Ltd (601019.ss) Valoración de DCF |
Completamente Editable: Adáptelo A Sus Necesidades En Excel O Sheets
Diseño Profesional: Plantillas Confiables Y Estándares De La Industria
Predeterminadas Para Un Uso Rápido Y Eficiente
Compatible con MAC / PC, completamente desbloqueado
No Se Necesita Experiencia; Fáciles De Seguir
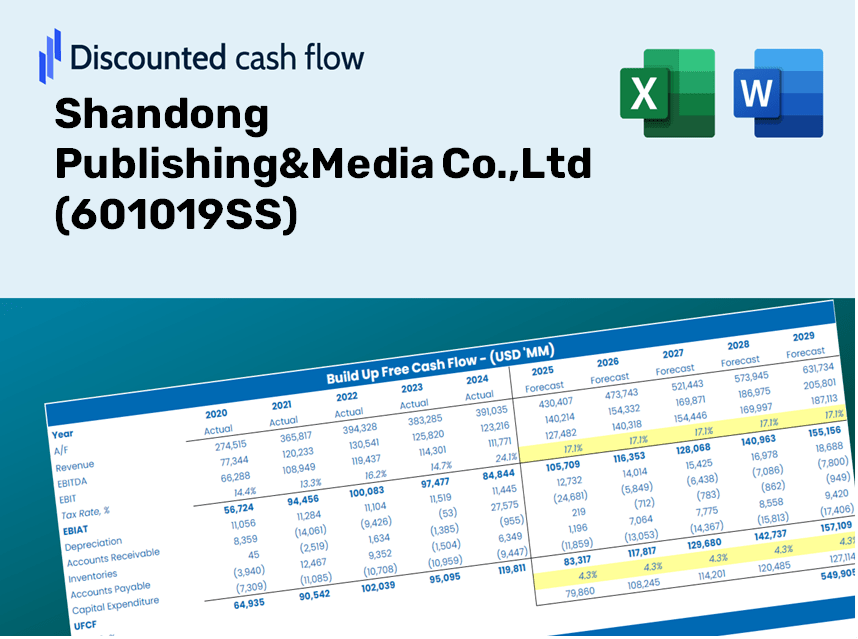
Shandong Publishing&Media Co.,Ltd (601019.SS) Bundle
¡Explore el potencial financiero de Shandong Publishing & Media Co., Ltd (601019SS) con nuestra calculadora DCF fácil de usar! Ingrese sus proyecciones para el crecimiento, los márgenes y los gastos para determinar el valor intrínseco de Shandong Publishing & Media Co., Ltd (601019SS) y refinar su enfoque de inversión.
What You Will Receive
- Comprehensive 601019SS Financials: Access to both historical and projected data for precise valuation.
- Customizable Inputs: Adjust WACC, tax rates, revenue growth, and capital expenditures to fit your analysis.
- Automated Calculations: Dynamic calculations for intrinsic value and NPV.
- Scenario Analysis: Explore various scenarios to assess Shandong Publishing & Media Co., Ltd's future performance.
- User-Friendly and Professional Design: Crafted for experts while remaining approachable for newcomers.
Key Features
- Pre-Loaded Data: Comprehensive access to Shandong Publishing & Media Co., Ltd's historical financial records and projected forecasts.
- Fully Adjustable Inputs: Customize WACC, tax rates, revenue growth, and EBITDA margins to suit your analysis.
- Instant Results: Observe the real-time recalculation of Shandong Publishing & Media Co., Ltd’s intrinsic value.
- Clear Visual Outputs: Intuitive dashboard charts illustrate valuation results and essential metrics.
- Built for Accuracy: A professional-grade tool designed for analysts, investors, and finance specialists.
How It Works
- Step 1: Download the Excel file.
- Step 2: Review pre-filled data for Shandong Publishing & Media Co., Ltd (601019SS), including historical and projected figures.
- Step 3: Modify key assumptions (highlighted in yellow) according to your analysis.
- Step 4: Observe real-time recalculations of Shandong Publishing & Media's intrinsic value.
- Step 5: Utilize the results for making investment decisions or for reporting purposes.
Why Select This Calculator for Shandong Publishing & Media Co., Ltd (601019SS)?
- User-Friendly Interface: Perfectly tailored for both novices and seasoned users.
- Customizable Inputs: Easily adjust parameters to fit your financial analysis needs.
- Real-Time Feedback: Observe immediate changes in Shandong Publishing & Media’s valuation as you modify the inputs.
- Pre-Loaded Data: Comes with actual financial figures for Shandong Publishing & Media for a swift evaluation.
- Favored by Experts: Routinely utilized by investors and analysts for making well-informed choices.
Who Should Benefit from This Product?
- Students of Publishing and Media: Master industry-specific analysis techniques using real-world examples.
- Researchers: Integrate authoritative models and frameworks into academic studies or projects.
- Investors: Validate your strategies and evaluate the market performance of Shandong Publishing&Media Co.,Ltd (601019SS).
- Market Analysts: Enhance your efficiency with a tailor-made, ready-to-use valuation model.
- Entrepreneurs: Discover how large public firms like Shandong Publishing&Media Co.,Ltd (601019SS) conduct their evaluations.
Contents of the Template
- Pre-Filled Data: Features historical financials and forecasts for Shandong Publishing & Media Co., Ltd (601019SS).
- Discounted Cash Flow Model: Editable DCF valuation model with automated calculations.
- Weighted Average Cost of Capital (WACC): A dedicated worksheet for WACC calculations based on user-defined inputs.
- Key Financial Ratios: Evaluate the profitability, efficiency, and leverage of Shandong Publishing & Media Co., Ltd (601019SS).
- Customizable Inputs: Easily modify revenue growth rates, profit margins, and tax rates.
- Clear Dashboard: Visual representation of key valuation results through charts and tables.
Disclaimer
All information, articles, and product details provided on this website are for general informational and educational purposes only. We do not claim any ownership over, nor do we intend to infringe upon, any trademarks, copyrights, logos, brand names, or other intellectual property mentioned or depicted on this site. Such intellectual property remains the property of its respective owners, and any references here are made solely for identification or informational purposes, without implying any affiliation, endorsement, or partnership.
We make no representations or warranties, express or implied, regarding the accuracy, completeness, or suitability of any content or products presented. Nothing on this website should be construed as legal, tax, investment, financial, medical, or other professional advice. In addition, no part of this site—including articles or product references—constitutes a solicitation, recommendation, endorsement, advertisement, or offer to buy or sell any securities, franchises, or other financial instruments, particularly in jurisdictions where such activity would be unlawful.
All content is of a general nature and may not address the specific circumstances of any individual or entity. It is not a substitute for professional advice or services. Any actions you take based on the information provided here are strictly at your own risk. You accept full responsibility for any decisions or outcomes arising from your use of this website and agree to release us from any liability in connection with your use of, or reliance upon, the content or products found herein.