
|
Shandong Yulong Gold Co., Ltd. (601028.SS) Valoración de DCF |
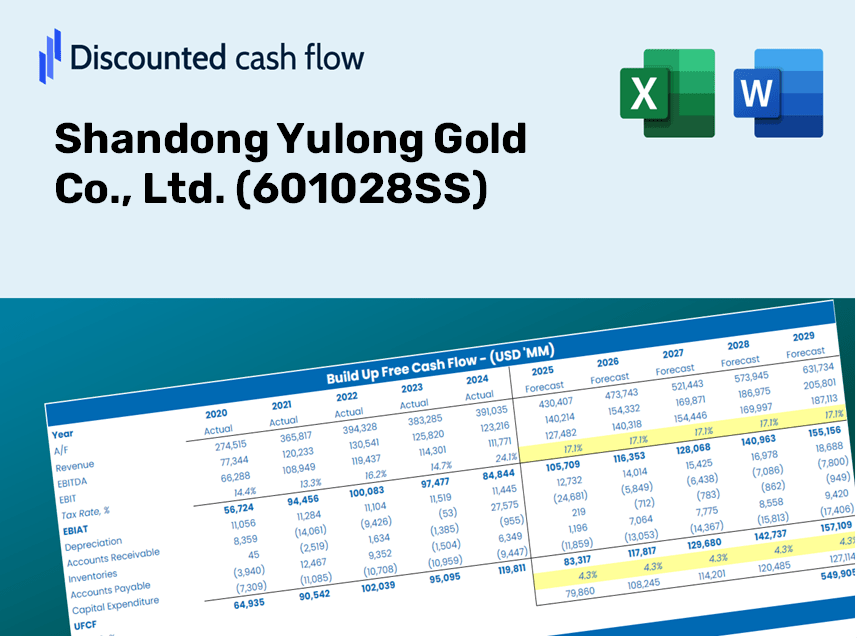
Completamente Editable: Adáptelo A Sus Necesidades En Excel O Sheets
Diseño Profesional: Plantillas Confiables Y Estándares De La Industria
Predeterminadas Para Un Uso Rápido Y Eficiente
Compatible con MAC / PC, completamente desbloqueado
No Se Necesita Experiencia; Fáciles De Seguir
Shandong Yulong Gold Co., Ltd. (601028.SS) Bundle
¿Busca evaluar el valor intrínseco de Shandong Yulong Gold Co., Ltd.? Nuestra calculadora DCF (601028SS) integra datos del mundo real con extensas características de personalización, lo que le permite refinar los pronósticos y mejorar sus estrategias de inversión.
Discounted Cash Flow (DCF) - (USD MM)
| Year | AY1 2019 |
AY2 2020 |
AY3 2021 |
AY4 2022 |
AY5 2023 |
FY1 2024 |
FY2 2025 |
FY3 2026 |
FY4 2027 |
FY5 2028 |
|---|---|---|---|---|---|---|---|---|---|---|
| Revenue | 1,839.5 | 11,908.3 | 11,351.9 | 10,935.9 | 2,424.0 | 2,507.8 | 2,594.5 | 2,684.2 | 2,777.0 | 2,873.0 |
| Revenue Growth, % | 0 | 547.37 | -4.67 | -3.67 | -77.83 | 3.46 | 3.46 | 3.46 | 3.46 | 3.46 |
| EBITDA | 12.9 | 124.1 | 386.8 | 418.8 | 833.0 | 217.4 | 224.9 | 232.7 | 240.7 | 249.1 |
| EBITDA, % | 0.70044 | 1.04 | 3.41 | 3.83 | 34.37 | 8.67 | 8.67 | 8.67 | 8.67 | 8.67 |
| Depreciation | 12.1 | 1.4 | 8.3 | 23.5 | 132.6 | 32.2 | 33.4 | 34.5 | 35.7 | 36.9 |
| Depreciation, % | 0.65748 | 0.01152476 | 0.07271474 | 0.21498 | 5.47 | 1.29 | 1.29 | 1.29 | 1.29 | 1.29 |
| EBIT | .8 | 122.8 | 378.5 | 395.3 | 700.4 | 185.2 | 191.6 | 198.2 | 205.0 | 212.1 |
| EBIT, % | 0.04295973 | 1.03 | 3.33 | 3.61 | 28.89 | 7.38 | 7.38 | 7.38 | 7.38 | 7.38 |
| Total Cash | 1,058.6 | 1,103.2 | 1,176.7 | 449.7 | 1,217.9 | 659.7 | 682.5 | 706.1 | 730.6 | 755.8 |
| Total Cash, percent | .0 | .0 | .0 | .0 | .0 | .0 | .0 | .0 | .0 | .0 |
| Account Receivables | 33.7 | 998.6 | 1,031.9 | 1,708.7 | 4,365.8 | 676.8 | 700.2 | 724.4 | 749.4 | 775.3 |
| Account Receivables, % | 1.83 | 8.39 | 9.09 | 15.62 | 180.1 | 26.99 | 26.99 | 26.99 | 26.99 | 26.99 |
| Inventories | 43.0 | 581.8 | 20.7 | 854.1 | 179.6 | 113.5 | 117.4 | 121.5 | 125.7 | 130.0 |
| Inventories, % | 2.34 | 4.89 | 0.18224 | 7.81 | 7.41 | 4.53 | 4.53 | 4.53 | 4.53 | 4.53 |
| Accounts Payable | 42.1 | 165.8 | 162.3 | 753.5 | 2,448.7 | 561.8 | 581.2 | 601.3 | 622.1 | 643.6 |
| Accounts Payable, % | 2.29 | 1.39 | 1.43 | 6.89 | 101.02 | 22.4 | 22.4 | 22.4 | 22.4 | 22.4 |
| Capital Expenditure | -31.0 | -3.2 | -2.1 | -52.1 | -383.6 | -90.4 | -93.6 | -96.8 | -100.1 | -103.6 |
| Capital Expenditure, % | -1.68 | -0.02649832 | -0.01890795 | -0.47608 | -15.82 | -3.61 | -3.61 | -3.61 | -3.61 | -3.61 |
| Tax Rate, % | 30.69 | 30.69 | 30.69 | 30.69 | 30.69 | 30.69 | 30.69 | 30.69 | 30.69 | 30.69 |
| EBITAT | -2.2 | 123.3 | 371.7 | 306.4 | 485.4 | 127.8 | 132.2 | 136.8 | 141.5 | 146.4 |
| Depreciation | ||||||||||
| Changes in Account Receivables | ||||||||||
| Changes in Inventories | ||||||||||
| Changes in Accounts Payable | ||||||||||
| Capital Expenditure | ||||||||||
| UFCF | -55.6 | -1,258.4 | 902.0 | -641.1 | -53.0 | 1,937.8 | 64.1 | 66.3 | 68.6 | 71.0 |
| WACC, % | 5.94 | 6.5 | 6.49 | 6.37 | 6.33 | 6.33 | 6.33 | 6.33 | 6.33 | 6.33 |
| PV UFCF | ||||||||||
| SUM PV UFCF | 2,040.2 | |||||||||
| Long Term Growth Rate, % | 2.00 | |||||||||
| Free cash flow (T + 1) | 72 | |||||||||
| Terminal Value | 1,673 | |||||||||
| Present Terminal Value | 1,231 | |||||||||
| Enterprise Value | 3,271 | |||||||||
| Net Debt | 427 | |||||||||
| Equity Value | 2,844 | |||||||||
| Diluted Shares Outstanding, MM | 781 | |||||||||
| Equity Value Per Share | 3.64 |
What You Will Receive
- Authentic Financial Data: Preloaded financial information – encompassing revenue to EBIT – based on actual and projected metrics specific to Shandong Yulong Gold Co., Ltd. (601028SS).
- Comprehensive Customization: Modify all key parameters (yellow cells) such as WACC, growth %, and tax rates as needed.
- Immediate Valuation Adjustments: Automatic recalculations to assess how changes affect the fair value of Shandong Yulong Gold Co., Ltd. (601028SS).
- Flexible Excel Template: Designed for easy edits, scenario analysis, and in-depth forecasting.
- Efficient and Precise: Eliminate the need to build models from the ground up while ensuring accuracy and adaptability.
Key Features
- Comprehensive Data: Access Shandong Yulong Gold Co., Ltd.'s historical financial records and insightful forecasts.
- Customizable Parameters: Modify variables such as WACC, tax rates, revenue growth, and EBITDA margins to fit your analysis.
- Real-Time Insights: View the intrinsic value of Shandong Yulong Gold Co., Ltd. recalibrated instantly.
- Intuitive Visual Representations: Engaging dashboard charts illustrate valuation outcomes and essential metrics.
- Precision Engineered: An expert-grade tool designed for analysts, investors, and finance professionals.
How It Functions
- Download the Template: Gain immediate access to the Excel-based (601028SS) DCF Calculator.
- Enter Your Assumptions: Modify the yellow-highlighted cells for growth rates, WACC, profit margins, and other variables.
- Real-Time Calculations: The model automatically recalculates the intrinsic value of Shandong Yulong Gold.
- Explore Scenarios: Test various assumptions to assess potential changes in valuation.
- Evaluate and Decide: Utilize the outcomes to inform your investment or financial assessments.
Why Choose Shandong Yulong Gold Co., Ltd. (601028SS)?
- Save Time: Skip the hassle of building a financial model from scratch – our solutions are ready for immediate use.
- Enhance Accuracy: Dependable financial insights and calculations minimize valuation errors.
- Completely Customizable: Adjust the model to suit your unique assumptions and forecasts.
- User-Friendly Interface: Intuitive charts and outputs simplify data analysis and interpretation.
- Preferred by Professionals: Crafted for industry experts who prioritize accuracy and functionality.
Who Can Benefit from This Product?
- Investors: Accurately assess Shandong Yulong Gold Co., Ltd.'s (601028SS) fair value prior to making investment choices.
- CFOs: Utilize a high-quality DCF model for enhanced financial reporting and analysis.
- Consultants: Easily modify the template to create valuation reports tailored for clients.
- Entrepreneurs: Discover insights into financial modeling techniques employed by leading mining companies.
- Educators: Employ it as a teaching resource to illustrate various valuation methodologies.
Contents of the Template
- Preloaded 601028SS Data: Comprehensive historical and projected financial figures, including revenue, EBIT, and capital expenditures.
- DCF and WACC Models: Advanced spreadsheets designed for calculating intrinsic value and Weighted Average Cost of Capital.
- Customizable Inputs: Cells highlighted in yellow for modifying revenue growth, tax rates, and discount rates.
- Financial Statements: Detailed annual and quarterly financial reports for in-depth analysis.
- Key Ratios: A set of profitability, leverage, and efficiency ratios to assess performance.
- Dashboard and Charts: Visual representations of valuation results and underlying assumptions.
Disclaimer
All information, articles, and product details provided on this website are for general informational and educational purposes only. We do not claim any ownership over, nor do we intend to infringe upon, any trademarks, copyrights, logos, brand names, or other intellectual property mentioned or depicted on this site. Such intellectual property remains the property of its respective owners, and any references here are made solely for identification or informational purposes, without implying any affiliation, endorsement, or partnership.
We make no representations or warranties, express or implied, regarding the accuracy, completeness, or suitability of any content or products presented. Nothing on this website should be construed as legal, tax, investment, financial, medical, or other professional advice. In addition, no part of this site—including articles or product references—constitutes a solicitation, recommendation, endorsement, advertisement, or offer to buy or sell any securities, franchises, or other financial instruments, particularly in jurisdictions where such activity would be unlawful.
All content is of a general nature and may not address the specific circumstances of any individual or entity. It is not a substitute for professional advice or services. Any actions you take based on the information provided here are strictly at your own risk. You accept full responsibility for any decisions or outcomes arising from your use of this website and agree to release us from any liability in connection with your use of, or reliance upon, the content or products found herein.