
|
Hsino Tower Group Co Ltd (601096.SS) Valoración de DCF |
Completamente Editable: Adáptelo A Sus Necesidades En Excel O Sheets
Diseño Profesional: Plantillas Confiables Y Estándares De La Industria
Predeterminadas Para Un Uso Rápido Y Eficiente
Compatible con MAC / PC, completamente desbloqueado
No Se Necesita Experiencia; Fáciles De Seguir
Hsino Tower Group Co., Ltd. (601096.SS) Bundle
¡Mejore sus opciones de inversión con la calculadora DCF (601096SS)! Coloque en datos financieros auténticos de Hsino Tower Group Co Ltd, ajuste las proyecciones y gastos de crecimiento, y observe cómo estas modificaciones afectan el valor intrínseco de (601096SS) en tiempo real.
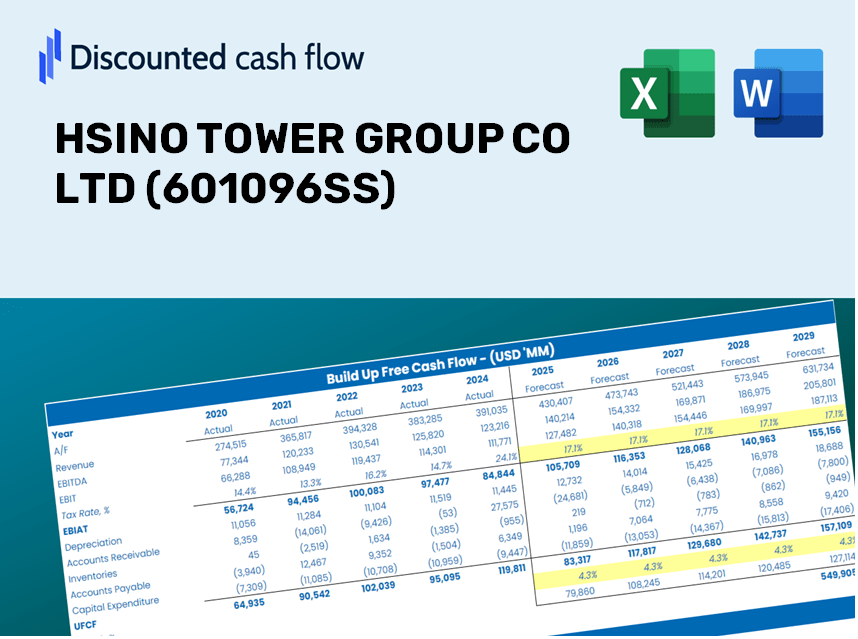
Discounted Cash Flow (DCF) - (USD MM)
| Year | AY1 2020 |
AY2 2021 |
AY3 2022 |
AY4 2023 |
AY5 2024 |
FY1 2025 |
FY2 2026 |
FY3 2027 |
FY4 2028 |
FY5 2029 |
|---|---|---|---|---|---|---|---|---|---|---|
| Revenue | 6,052.7 | 7,133.5 | 8,731.6 | 9,295.2 | 10,138.7 | 11,552.8 | 13,164.1 | 15,000.1 | 17,092.1 | 19,476.0 |
| Revenue Growth, % | 0 | 17.86 | 22.4 | 6.46 | 9.07 | 13.95 | 13.95 | 13.95 | 13.95 | 13.95 |
| EBITDA | 963.9 | 421.2 | 334.8 | 280.5 | 410.3 | 756.2 | 861.7 | 981.9 | 1,118.8 | 1,274.9 |
| EBITDA, % | 15.93 | 5.91 | 3.83 | 3.02 | 4.05 | 6.55 | 6.55 | 6.55 | 6.55 | 6.55 |
| Depreciation | 77.8 | 81.5 | 90.3 | 101.9 | 104.7 | 129.2 | 147.2 | 167.7 | 191.1 | 217.8 |
| Depreciation, % | 1.29 | 1.14 | 1.03 | 1.1 | 1.03 | 1.12 | 1.12 | 1.12 | 1.12 | 1.12 |
| EBIT | 886.1 | 339.7 | 244.5 | 178.6 | 305.6 | 627.1 | 714.5 | 814.2 | 927.7 | 1,057.1 |
| EBIT, % | 14.64 | 4.76 | 2.8 | 1.92 | 3.01 | 5.43 | 5.43 | 5.43 | 5.43 | 5.43 |
| Total Cash | 333.5 | 603.1 | 404.9 | 1,553.7 | 1,521.7 | 1,162.8 | 1,325.0 | 1,509.8 | 1,720.3 | 1,960.3 |
| Total Cash, percent | .0 | .0 | .0 | .0 | .0 | .0 | .0 | .0 | .0 | .0 |
| Account Receivables | 3,634.0 | 3,129.4 | 3,011.9 | 3,226.6 | 2,802.4 | 4,638.6 | 5,285.5 | 6,022.7 | 6,862.7 | 7,819.8 |
| Account Receivables, % | 60.04 | 43.87 | 34.49 | 34.71 | 27.64 | 40.15 | 40.15 | 40.15 | 40.15 | 40.15 |
| Inventories | 1,868.2 | 3,200.3 | 3,181.0 | 2,632.5 | 2,292.0 | 3,768.2 | 4,293.8 | 4,892.6 | 5,575.0 | 6,352.6 |
| Inventories, % | 30.87 | 44.86 | 36.43 | 28.32 | 22.61 | 32.62 | 32.62 | 32.62 | 32.62 | 32.62 |
| Accounts Payable | 1,116.0 | 1,679.3 | 1,736.4 | 1,839.6 | 3,285.5 | 2,635.5 | 3,003.0 | 3,421.9 | 3,899.1 | 4,442.9 |
| Accounts Payable, % | 18.44 | 23.54 | 19.89 | 19.79 | 32.41 | 22.81 | 22.81 | 22.81 | 22.81 | 22.81 |
| Capital Expenditure | -35.7 | -57.5 | -50.0 | -84.8 | -218.9 | -116.5 | -132.7 | -151.2 | -172.3 | -196.4 |
| Capital Expenditure, % | -0.59025 | -0.80611 | -0.57272 | -0.91245 | -2.16 | -1.01 | -1.01 | -1.01 | -1.01 | -1.01 |
| Tax Rate, % | 21.06 | 21.06 | 21.06 | 21.06 | 21.06 | 21.06 | 21.06 | 21.06 | 21.06 | 21.06 |
| EBITAT | 631.5 | 264.8 | 210.0 | 148.8 | 241.3 | 498.3 | 567.8 | 647.0 | 737.3 | 840.1 |
| Depreciation | ||||||||||
| Changes in Account Receivables | ||||||||||
| Changes in Inventories | ||||||||||
| Changes in Accounts Payable | ||||||||||
| Capital Expenditure | ||||||||||
| UFCF | -3,712.7 | 24.7 | 444.2 | 602.9 | 2,337.6 | -3,451.4 | -222.6 | -253.7 | -289.0 | -329.4 |
| WACC, % | 10.43 | 10.44 | 10.46 | 10.45 | 10.44 | 10.44 | 10.44 | 10.44 | 10.44 | 10.44 |
| PV UFCF | ||||||||||
| SUM PV UFCF | -3,890.5 | |||||||||
| Long Term Growth Rate, % | 2.00 | |||||||||
| Free cash flow (T + 1) | -336 | |||||||||
| Terminal Value | -3,979 | |||||||||
| Present Terminal Value | -2,421 | |||||||||
| Enterprise Value | -6,312 | |||||||||
| Net Debt | -1,106 | |||||||||
| Equity Value | -5,206 | |||||||||
| Diluted Shares Outstanding, MM | 2,675 | |||||||||
| Equity Value Per Share | -1.95 |
What You Will Receive
- Pre-Filled Financial Model: Utilize HSINO TOWER GROUP CO LTD's actual data for accurate DCF valuation.
- Comprehensive Forecast Control: Modify revenue growth, profit margins, WACC, and other essential drivers.
- Instantaneous Calculations: Automatic updates provide real-time results as you implement changes.
- Investor-Ready Template: A polished Excel file crafted for high-quality valuation purposes.
- Customizable and Reusable: Designed with flexibility in mind, enabling repeated use for in-depth forecasts.
Key Features
- 🔍 Real-Life HSINO TOWER Financials: Pre-filled historical and projected data for HSINO TOWER GROUP CO LTD (601096SS).
- ✏️ Fully Customizable Inputs: Adjust all critical parameters (yellow cells) such as WACC, growth %, and tax rates.
- 📊 Professional DCF Valuation: Built-in formulas assess HSINO TOWER's intrinsic value using the Discounted Cash Flow method.
- ⚡ Instant Results: Visualize HSINO TOWER's valuation immediately after making adjustments.
- Scenario Analysis: Evaluate and compare outcomes for different financial assumptions side-by-side.
How It Operates
- Download the Framework: Gain immediate access to the Excel-based HSINO TOWER GROUP CO LTD (601096SS) DCF Calculator.
- Input Your Parameters: Modify the yellow-highlighted cells for growth rates, WACC, margins, and additional variables.
- Instant Calculations: The model automatically computes the intrinsic value of HSINO TOWER GROUP CO LTD (601096SS).
- Test Scenarios: Explore different assumptions to assess potential changes in valuation.
- Analyze and Make Decisions: Utilize the outcomes to inform your investment or financial assessments.
Why Choose This Calculator for HSINO TOWER GROUP CO LTD (601096SS)?
- Designed for Experts: A sophisticated tool tailored for analysts, CFOs, and financial consultants.
- Accurate Data: Historical and projected financials for HSINO TOWER GROUP CO LTD preloaded for precision.
- Comprehensive Scenario Analysis: Effortlessly simulate various forecasts and assumptions.
- Insightful Outputs: Automatically determines intrinsic value, NPV, and essential financial metrics.
- User-Friendly: Step-by-step guidance ensures a seamless experience throughout the process.
Who Can Benefit from HSINO TOWER GROUP CO LTD (601096SS)?
- Investors: Make informed decisions with our advanced valuation tools.
- Financial Analysts: Streamline your workflow with our customizable DCF model.
- Consultants: Easily modify the template for impactful client presentations or reports.
- Finance Enthusiasts: Enhance your knowledge of valuation methods through practical examples.
- Educators and Students: Utilize this resource as a hands-on learning aid in finance courses.
Contents of the Template
- Operating and Balance Sheet Data: Pre-filled historical data and forecasts for HSINO TOWER GROUP CO LTD (601096SS), including revenue, EBITDA, EBIT, and capital expenditures.
- WACC Calculation: A dedicated sheet for the Weighted Average Cost of Capital (WACC), featuring parameters such as Beta, risk-free rate, and share price.
- DCF Valuation (Unlevered and Levered): Customizable Discounted Cash Flow models that illustrate intrinsic value with thorough calculations.
- Financial Statements: Pre-loaded annual and quarterly financial statements to facilitate analysis.
- Key Ratios: Includes important profitability, leverage, and efficiency ratios for HSINO TOWER GROUP CO LTD (601096SS).
- Dashboard and Charts: A visual summary of valuation outputs and assumptions for easy analysis of results.
Disclaimer
All information, articles, and product details provided on this website are for general informational and educational purposes only. We do not claim any ownership over, nor do we intend to infringe upon, any trademarks, copyrights, logos, brand names, or other intellectual property mentioned or depicted on this site. Such intellectual property remains the property of its respective owners, and any references here are made solely for identification or informational purposes, without implying any affiliation, endorsement, or partnership.
We make no representations or warranties, express or implied, regarding the accuracy, completeness, or suitability of any content or products presented. Nothing on this website should be construed as legal, tax, investment, financial, medical, or other professional advice. In addition, no part of this site—including articles or product references—constitutes a solicitation, recommendation, endorsement, advertisement, or offer to buy or sell any securities, franchises, or other financial instruments, particularly in jurisdictions where such activity would be unlawful.
All content is of a general nature and may not address the specific circumstances of any individual or entity. It is not a substitute for professional advice or services. Any actions you take based on the information provided here are strictly at your own risk. You accept full responsibility for any decisions or outcomes arising from your use of this website and agree to release us from any liability in connection with your use of, or reliance upon, the content or products found herein.