
|
Tianfeng Securities Co., Ltd. (601162.ss) Valoración de DCF |
Completamente Editable: Adáptelo A Sus Necesidades En Excel O Sheets
Diseño Profesional: Plantillas Confiables Y Estándares De La Industria
Predeterminadas Para Un Uso Rápido Y Eficiente
Compatible con MAC / PC, completamente desbloqueado
No Se Necesita Experiencia; Fáciles De Seguir
Tianfeng Securities Co., Ltd. (601162.SS) Bundle
¡Simplifique la valoración de Tianfeng Securities Co., Ltd. (601162ss) con esta calculadora DCF personalizable! Con el Real Tianfeng Securities Co., Ltd. (601162SS) finanzas y entradas de pronóstico ajustables, puede probar escenarios y descubrir Tianfeng Securities Co., Ltd. (601162SS) valor razonable en minutos.
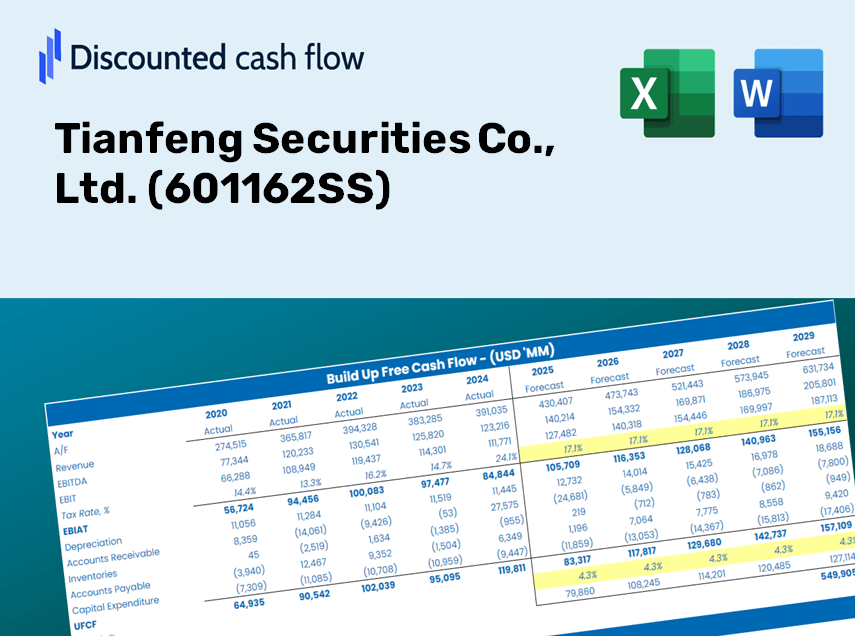
Discounted Cash Flow (DCF) - (USD MM)
| Year | AY1 2020 |
AY2 2021 |
AY3 2022 |
AY4 2023 |
AY5 2024 |
FY1 2025 |
FY2 2026 |
FY3 2027 |
FY4 2028 |
FY5 2029 |
|---|---|---|---|---|---|---|---|---|---|---|
| Revenue | 4,261.3 | 7,197.8 | 1,731.8 | 3,410.1 | 5,548.8 | 7,665.6 | 10,590.0 | 14,630.1 | 20,211.4 | 27,921.9 |
| Revenue Growth, % | 0 | 68.91 | -75.94 | 96.91 | 62.71 | 38.15 | 38.15 | 38.15 | 38.15 | 38.15 |
| EBITDA | 2,481.9 | 2,541.8 | -1,632.2 | .0 | 243.7 | 56.7 | 78.4 | 108.3 | 149.6 | 206.7 |
| EBITDA, % | 58.24 | 35.31 | -94.25 | 0 | 4.39 | 0.74016 | 0.74016 | 0.74016 | 0.74016 | 0.74016 |
| Depreciation | 103.9 | 234.5 | 244.3 | 251.0 | 238.7 | 482.3 | 666.3 | 920.6 | 1,271.7 | 1,756.9 |
| Depreciation, % | 2.44 | 3.26 | 14.1 | 7.36 | 4.3 | 6.29 | 6.29 | 6.29 | 6.29 | 6.29 |
| EBIT | 2,378.0 | 2,307.3 | -1,876.5 | -251.0 | 5.1 | -297.5 | -411.1 | -567.9 | -784.5 | -1,083.8 |
| EBIT, % | 55.8 | 32.06 | -108.35 | -7.36 | 0.0914865 | -3.88 | -3.88 | -3.88 | -3.88 | -3.88 |
| Total Cash | 26,167.4 | 9,066.1 | 27,545.8 | 16,969.8 | 31,619.7 | 7,665.6 | 10,590.0 | 14,630.1 | 20,211.4 | 27,921.9 |
| Total Cash, percent | .0 | .0 | .0 | .0 | .0 | .0 | .0 | .0 | .0 | .0 |
| Account Receivables | 1,395.3 | 2,624.4 | 3,771.9 | 7,645.9 | 3,311.2 | 5,042.1 | 6,965.7 | 9,623.0 | 13,294.2 | 18,365.9 |
| Account Receivables, % | 32.74 | 36.46 | 217.8 | 224.21 | 59.67 | 65.78 | 65.78 | 65.78 | 65.78 | 65.78 |
| Inventories | .0 | 17,271.7 | 20,914.9 | .0 | .0 | 3,066.3 | 4,236.0 | 5,852.0 | 8,084.6 | 11,168.8 |
| Inventories, % | 0 | 239.96 | 1207.68 | 0 | 0 | 40 | 40 | 40 | 40 | 40 |
| Accounts Payable | 280.0 | 3.3 | 2.7 | 4.0 | 9.9 | 108.4 | 149.7 | 206.8 | 285.7 | 394.7 |
| Accounts Payable, % | 6.57 | 0.04599605 | 0.15572 | 0.11811 | 0.17779 | 1.41 | 1.41 | 1.41 | 1.41 | 1.41 |
| Capital Expenditure | -175.5 | -316.4 | -246.4 | -193.3 | -109.7 | -465.9 | -643.6 | -889.2 | -1,228.4 | -1,697.1 |
| Capital Expenditure, % | -4.12 | -4.4 | -14.23 | -5.67 | -1.98 | -6.08 | -6.08 | -6.08 | -6.08 | -6.08 |
| Tax Rate, % | 685.24 | 685.24 | 685.24 | 685.24 | 685.24 | 685.24 | 685.24 | 685.24 | 685.24 | 685.24 |
| EBITAT | 1,217.9 | 1,927.4 | -1,502.7 | -240.6 | -29.7 | -184.9 | -255.4 | -352.9 | -487.5 | -673.5 |
| Depreciation | ||||||||||
| Changes in Account Receivables | ||||||||||
| Changes in Inventories | ||||||||||
| Changes in Accounts Payable | ||||||||||
| Capital Expenditure | ||||||||||
| UFCF | 31.0 | -16,932.0 | -6,296.1 | 16,859.3 | 4,439.7 | -4,867.2 | -3,284.7 | -4,537.8 | -6,268.9 | -8,660.5 |
| WACC, % | 6.95 | 8.16 | 8.03 | 8.62 | 5.04 | 7.36 | 7.36 | 7.36 | 7.36 | 7.36 |
| PV UFCF | ||||||||||
| SUM PV UFCF | -21,841.0 | |||||||||
| Long Term Growth Rate, % | 2.00 | |||||||||
| Free cash flow (T + 1) | -8,834 | |||||||||
| Terminal Value | -164,808 | |||||||||
| Present Terminal Value | -115,548 | |||||||||
| Enterprise Value | -137,389 | |||||||||
| Net Debt | 12,787 | |||||||||
| Equity Value | -150,176 | |||||||||
| Diluted Shares Outstanding, MM | 8,666 | |||||||||
| Equity Value Per Share | -17.33 |
What You Will Receive
- Authentic (601162SS) Financial Data: Equipped with Tianfeng Securities’ historical and forecasted data for accurate analysis.
- Completely Customizable Template: Easily adjust essential inputs such as revenue growth, WACC, and EBITDA percentage.
- Instant Calculations: Watch the intrinsic value of (601162SS) update in real-time as you make modifications.
- Expert Valuation Tool: Tailored for investors, analysts, and consultants aiming for precise DCF evaluations.
- Intuitive Design: A straightforward layout and clear instructions suitable for users of all skill levels.
Key Features
- Comprehensive Data: Access to Tianfeng Securities Co., Ltd. historical financial statements and pre-filled projections.
- Customizable Inputs: Adjust WACC, tax rates, revenue growth, and EBITDA margins to fit your analysis.
- Real-Time Insights: Watch as the intrinsic value of Tianfeng Securities Co., Ltd. recalculates instantly.
- Engaging Visual Outputs: Interactive dashboard charts provide clear displays of valuation outcomes and key metrics.
- Designed for Precision: A reliable tool tailored for analysts, investors, and finance professionals.
How It Works
- Download the Template: Gain immediate access to the Excel-based Tianfeng Securities DCF Calculator.
- Input Your Assumptions: Modify the yellow-highlighted fields for growth rates, WACC, margins, and additional parameters.
- Instant Calculations: The model will automatically calculate the intrinsic value of Tianfeng Securities (601162SS).
- Test Scenarios: Explore different assumptions to assess potential valuation variations.
- Analyze and Decide: Utilize the results to inform your investment or financial analysis decisions.
Why Choose Tianfeng Securities Calculator?
- Accuracy: Utilizes real Tianfeng Securities financial data to ensure accuracy.
- Flexibility: Tailored for users to effortlessly test and adjust inputs.
- Time-Saving: Avoid the complexities of constructing a financial model from scratch.
- Professional-Grade: Crafted with the precision and usability expected at the CFO level.
- User-Friendly: Designed to be straightforward, even for users without deep financial modeling expertise.
Who Can Benefit from This Product?
- Investors: Assess the valuation of Tianfeng Securities Co., Ltd. (601162SS) to make informed trading decisions.
- CFOs and Financial Analysts: Optimize valuation processes and validate financial forecasts for better insights.
- Startup Founders: Understand how established firms like Tianfeng Securities Co., Ltd. (601162SS) are appraised.
- Consultants: Provide expert valuation reports to enhance client services.
- Students and Educators: Utilize real-world data from Tianfeng Securities Co., Ltd. (601162SS) to learn and teach valuation methods.
Contents of the Template
- Operating and Balance Sheet Data: Pre-filled historical data and forecasts for Tianfeng Securities Co., Ltd. (601162SS), including revenue, EBITDA, EBIT, and capital expenditures.
- WACC Calculation: A dedicated section for Weighted Average Cost of Capital (WACC), covering parameters such as Beta, risk-free rate, and share price.
- DCF Valuation (Unlevered and Levered): Customizable Discounted Cash Flow models that display intrinsic value along with detailed calculations.
- Financial Statements: Pre-loaded annual and quarterly financial statements to facilitate thorough analysis.
- Key Ratios: Features profitability, leverage, and efficiency ratios specific to Tianfeng Securities Co., Ltd. (601162SS).
- Dashboard and Charts: A visual summary of valuation outputs and assumptions to simplify the analysis of results.
Disclaimer
All information, articles, and product details provided on this website are for general informational and educational purposes only. We do not claim any ownership over, nor do we intend to infringe upon, any trademarks, copyrights, logos, brand names, or other intellectual property mentioned or depicted on this site. Such intellectual property remains the property of its respective owners, and any references here are made solely for identification or informational purposes, without implying any affiliation, endorsement, or partnership.
We make no representations or warranties, express or implied, regarding the accuracy, completeness, or suitability of any content or products presented. Nothing on this website should be construed as legal, tax, investment, financial, medical, or other professional advice. In addition, no part of this site—including articles or product references—constitutes a solicitation, recommendation, endorsement, advertisement, or offer to buy or sell any securities, franchises, or other financial instruments, particularly in jurisdictions where such activity would be unlawful.
All content is of a general nature and may not address the specific circumstances of any individual or entity. It is not a substitute for professional advice or services. Any actions you take based on the information provided here are strictly at your own risk. You accept full responsibility for any decisions or outcomes arising from your use of this website and agree to release us from any liability in connection with your use of, or reliance upon, the content or products found herein.