
|
Xiamen Bank Co., Ltd. (601187.ss) Valoración de DCF |
Completamente Editable: Adáptelo A Sus Necesidades En Excel O Sheets
Diseño Profesional: Plantillas Confiables Y Estándares De La Industria
Predeterminadas Para Un Uso Rápido Y Eficiente
Compatible con MAC / PC, completamente desbloqueado
No Se Necesita Experiencia; Fáciles De Seguir
Xiamen Bank Co., Ltd. (601187.SS) Bundle
¡Mejore su estrategia de inversión con la calculadora DCF (601187SS)! Utilice datos financieros reales de Xiamen Bank Co., Ltd., ajuste las proyecciones y gastos de crecimiento, y observe instantáneamente cómo estas modificaciones afectan el valor intrínseco de (601187SS).
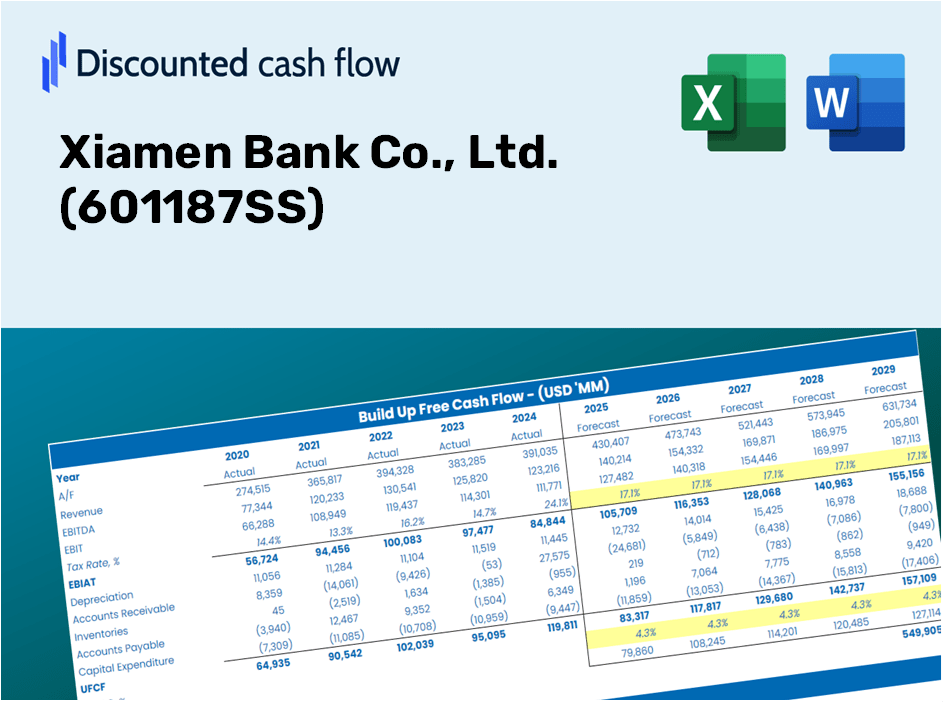
Discounted Cash Flow (DCF) - (USD MM)
| Year | AY1 2020 |
AY2 2021 |
AY3 2022 |
AY4 2023 |
AY5 2024 |
FY1 2025 |
FY2 2026 |
FY3 2027 |
FY4 2028 |
FY5 2029 |
|---|---|---|---|---|---|---|---|---|---|---|
| Revenue | 3,532.1 | 12,266.6 | 13,401.8 | 13,767.5 | 5,061.3 | 5,678.1 | 6,370.1 | 7,146.4 | 8,017.2 | 8,994.3 |
| Revenue Growth, % | 0 | 247.29 | 9.25 | 2.73 | -63.24 | 12.19 | 12.19 | 12.19 | 12.19 | 12.19 |
| EBITDA | 2,022.0 | 2,600.8 | 2,734.2 | -.5 | 3,060.5 | 1,809.2 | 2,029.7 | 2,277.1 | 2,554.6 | 2,865.9 |
| EBITDA, % | 57.25 | 21.2 | 20.4 | -0.00346879 | 60.47 | 31.86 | 31.86 | 31.86 | 31.86 | 31.86 |
| Depreciation | 186.1 | 238.5 | 259.1 | 301.8 | 325.2 | 201.7 | 226.3 | 253.9 | 284.8 | 319.5 |
| Depreciation, % | 5.27 | 1.94 | 1.93 | 2.19 | 6.42 | 3.55 | 3.55 | 3.55 | 3.55 | 3.55 |
| EBIT | 1,835.9 | 2,362.3 | 2,475.1 | -302.2 | 2,735.3 | 1,607.5 | 1,803.4 | 2,023.2 | 2,269.7 | 2,546.3 |
| EBIT, % | 51.98 | 19.26 | 18.47 | -2.2 | 54.04 | 28.31 | 28.31 | 28.31 | 28.31 | 28.31 |
| Total Cash | 37,533.9 | 59,869.3 | 53,785.7 | -60,449.3 | 49,821.0 | 3,406.9 | 3,822.0 | 4,287.8 | 4,810.3 | 5,396.6 |
| Total Cash, percent | .0 | .0 | .0 | .0 | .0 | .0 | .0 | .0 | .0 | .0 |
| Account Receivables | .0 | .0 | .0 | .0 | .0 | .0 | .0 | .0 | .0 | .0 |
| Account Receivables, % | 0 | 0 | 0 | 0 | 0 | 0 | 0 | 0 | 0 | 0 |
| Inventories | .0 | .0 | .0 | .0 | .0 | .0 | .0 | .0 | .0 | .0 |
| Inventories, % | 0 | 0 | 0 | 0 | 0 | 0 | 0 | 0 | 0 | 0 |
| Accounts Payable | .0 | .0 | .0 | .0 | .0 | .0 | .0 | .0 | .0 | .0 |
| Accounts Payable, % | 0 | 0 | 0 | 0 | 0 | 0 | 0 | 0 | 0 | 0 |
| Capital Expenditure | -217.3 | -331.3 | -550.3 | -340.1 | -313.8 | -245.6 | -275.6 | -309.1 | -346.8 | -389.1 |
| Capital Expenditure, % | -6.15 | -2.7 | -4.11 | -2.47 | -6.2 | -4.33 | -4.33 | -4.33 | -4.33 | -4.33 |
| Tax Rate, % | 5.14 | 5.14 | 5.14 | 5.14 | 5.14 | 5.14 | 5.14 | 5.14 | 5.14 | 5.14 |
| EBITAT | 1,823.2 | 2,169.0 | 2,506.6 | -304.8 | 2,594.6 | 1,562.4 | 1,752.9 | 1,966.5 | 2,206.1 | 2,475.0 |
| Depreciation | ||||||||||
| Changes in Account Receivables | ||||||||||
| Changes in Inventories | ||||||||||
| Changes in Accounts Payable | ||||||||||
| Capital Expenditure | ||||||||||
| UFCF | 1,792.0 | 2,076.2 | 2,215.4 | -343.1 | 2,606.0 | 1,518.5 | 1,703.6 | 1,911.2 | 2,144.1 | 2,405.4 |
| WACC, % | 5.58 | 5.23 | 5.61 | 5.61 | 5.37 | 5.48 | 5.48 | 5.48 | 5.48 | 5.48 |
| PV UFCF | ||||||||||
| SUM PV UFCF | 8,173.3 | |||||||||
| Long Term Growth Rate, % | 2.00 | |||||||||
| Free cash flow (T + 1) | 2,454 | |||||||||
| Terminal Value | 70,472 | |||||||||
| Present Terminal Value | 53,968 | |||||||||
| Enterprise Value | 62,141 | |||||||||
| Net Debt | 113,915 | |||||||||
| Equity Value | -51,774 | |||||||||
| Diluted Shares Outstanding, MM | 2,915 | |||||||||
| Equity Value Per Share | -17.76 |
What You Will Receive
- Comprehensive Financial Model: Xiamen Bank's actual figures facilitate accurate DCF valuation.
- Complete Forecast Flexibility: Modify revenue growth, profit margins, WACC, and other critical variables.
- Real-Time Calculations: Automatic updates allow you to view results instantly as adjustments are made.
- Professional-Grade Template: A polished Excel file crafted for high-quality valuation.
- Customizable and Reusable: Designed for adaptability, enabling multiple uses for in-depth forecasts.
Key Features
- Customizable Financial Inputs: Adjust essential parameters such as loan growth, net interest margin, and operational expenses.
- Instant DCF Valuation: Quickly computes intrinsic value, NPV, and additional financial metrics.
- High-Precision Accuracy: Leverages Xiamen Bank's actual financial data for credible valuation results.
- Simplified Scenario Analysis: Effortlessly examine various assumptions and evaluate their impacts.
- Efficiency Booster: Remove the complexity of developing intricate valuation models from the ground up.
How It Operates
- Download the Template: Gain instant access to the Excel-based Xiamen Bank DCF Calculator (601187SS).
- Input Your Assumptions: Modify the yellow-highlighted cells to set growth rates, WACC, margins, and additional factors.
- Instant Calculations: The model will automatically calculate Xiamen Bank's intrinsic value.
- Test Scenarios: Explore various assumptions to see how they impact valuation results.
- Analyze and Decide: Utilize the findings to inform your investment or financial decisions.
Why Opt for Xiamen Bank’s Financial Calculator?
- Time-Saving: Skip the hassle of building a DCF model from the ground up – it’s ready for immediate use.
- Enhanced Accuracy: Dependable financial data and formulas minimize valuation errors.
- Completely Customizable: Adjust the model to align with your specific assumptions and forecasts.
- User-Friendly: Intuitive charts and outputs facilitate easy result interpretation.
- Endorsed by Professionals: Crafted for experts who prioritize accuracy and functionality.
Who Can Benefit from This Product?
- Professional Investors: Develop comprehensive and trustworthy valuation models for analyzing portfolios related to Xiamen Bank Co., Ltd. (601187SS).
- Corporate Finance Teams: Evaluate valuation scenarios to shape internal financial strategies for Xiamen Bank Co., Ltd. (601187SS).
- Consultants and Advisors: Deliver precise valuation insights for clients interested in investing in Xiamen Bank Co., Ltd. (601187SS).
- Students and Educators: Utilize real-world data to enhance learning and practice in financial modeling with Xiamen Bank Co., Ltd. (601187SS).
- Banking Enthusiasts: Gain insights into how financial institutions like Xiamen Bank Co., Ltd. (601187SS) are valued within the market.
Contents of the Template
- Pre-Filled Data: Contains historical financials and forecasts for Xiamen Bank Co., Ltd. (601187SS).
- Discounted Cash Flow Model: An editable DCF valuation model featuring automatic calculations.
- Weighted Average Cost of Capital (WACC): A specific sheet designed for WACC calculations based on your custom inputs.
- Key Financial Ratios: Evaluate Xiamen Bank's profitability, efficiency, and leverage metrics.
- Customizable Inputs: Easily adjust revenue growth rates, profit margins, and tax rates.
- Clear Dashboard: Visual summaries of key valuation results presented in charts and tables.
Disclaimer
All information, articles, and product details provided on this website are for general informational and educational purposes only. We do not claim any ownership over, nor do we intend to infringe upon, any trademarks, copyrights, logos, brand names, or other intellectual property mentioned or depicted on this site. Such intellectual property remains the property of its respective owners, and any references here are made solely for identification or informational purposes, without implying any affiliation, endorsement, or partnership.
We make no representations or warranties, express or implied, regarding the accuracy, completeness, or suitability of any content or products presented. Nothing on this website should be construed as legal, tax, investment, financial, medical, or other professional advice. In addition, no part of this site—including articles or product references—constitutes a solicitation, recommendation, endorsement, advertisement, or offer to buy or sell any securities, franchises, or other financial instruments, particularly in jurisdictions where such activity would be unlawful.
All content is of a general nature and may not address the specific circumstances of any individual or entity. It is not a substitute for professional advice or services. Any actions you take based on the information provided here are strictly at your own risk. You accept full responsibility for any decisions or outcomes arising from your use of this website and agree to release us from any liability in connection with your use of, or reliance upon, the content or products found herein.