
|
Sichuan Em Technology Co., Ltd. (601208.SS) Valoración de DCF |
Completamente Editable: Adáptelo A Sus Necesidades En Excel O Sheets
Diseño Profesional: Plantillas Confiables Y Estándares De La Industria
Predeterminadas Para Un Uso Rápido Y Eficiente
Compatible con MAC / PC, completamente desbloqueado
No Se Necesita Experiencia; Fáciles De Seguir
Sichuan Em Technology Co., Ltd. (601208.SS) Bundle
¡Descubra el verdadero potencial de Sichuan Em Technology Co., Ltd. (601208SS) con nuestra calculadora DCF avanzada! Ajuste los supuestos clave, explore varios escenarios y evalúe los efectos de los cambios en la valoración de Sichuan EM Technology Co., Ltd. (601208SS), todo dentro de una sola plantilla de Excel.
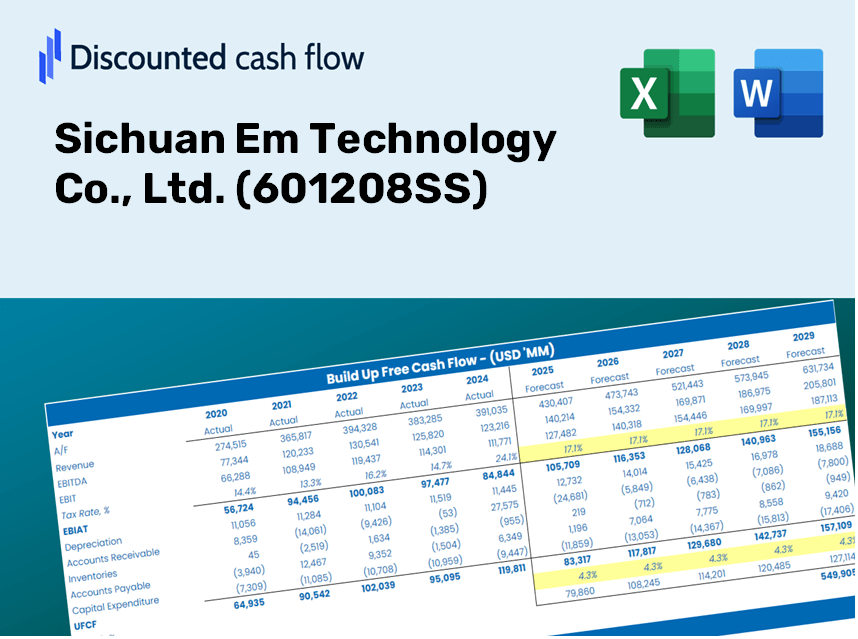
Discounted Cash Flow (DCF) - (USD MM)
| Year | AY1 2020 |
AY2 2021 |
AY3 2022 |
AY4 2023 |
AY5 2024 |
FY1 2025 |
FY2 2026 |
FY3 2027 |
FY4 2028 |
FY5 2029 |
|---|---|---|---|---|---|---|---|---|---|---|
| Revenue | 1,881.1 | 3,233.9 | 3,640.3 | 3,737.5 | 4,470.1 | 5,663.1 | 7,174.6 | 9,089.4 | 11,515.3 | 14,588.6 |
| Revenue Growth, % | 0 | 71.92 | 12.57 | 2.67 | 19.6 | 26.69 | 26.69 | 26.69 | 26.69 | 26.69 |
| EBITDA | 350.7 | 634.7 | 769.3 | 747.0 | 543.8 | 1,037.0 | 1,313.7 | 1,664.3 | 2,108.5 | 2,671.3 |
| EBITDA, % | 18.64 | 19.63 | 21.13 | 19.99 | 12.17 | 18.31 | 18.31 | 18.31 | 18.31 | 18.31 |
| Depreciation | 135.8 | 219.4 | 251.4 | 303.7 | 268.0 | 396.8 | 502.7 | 636.8 | 806.8 | 1,022.1 |
| Depreciation, % | 7.22 | 6.79 | 6.91 | 8.13 | 5.99 | 7.01 | 7.01 | 7.01 | 7.01 | 7.01 |
| EBIT | 214.9 | 415.3 | 517.9 | 443.3 | 275.8 | 640.2 | 811.1 | 1,027.5 | 1,301.8 | 1,649.2 |
| EBIT, % | 11.43 | 12.84 | 14.23 | 11.86 | 6.17 | 11.3 | 11.3 | 11.3 | 11.3 | 11.3 |
| Total Cash | 231.8 | 735.7 | 2,016.1 | 1,294.2 | 1,026.6 | 1,676.9 | 2,124.4 | 2,691.4 | 3,409.7 | 4,319.7 |
| Total Cash, percent | .0 | .0 | .0 | .0 | .0 | .0 | .0 | .0 | .0 | .0 |
| Account Receivables | 800.4 | 1,210.2 | 1,333.6 | 1,406.1 | 1,667.0 | 2,169.3 | 2,748.2 | 3,481.7 | 4,410.9 | 5,588.2 |
| Account Receivables, % | 42.55 | 37.42 | 36.64 | 37.62 | 37.29 | 38.31 | 38.31 | 38.31 | 38.31 | 38.31 |
| Inventories | 238.7 | 278.5 | 427.8 | 498.5 | 417.9 | 631.3 | 799.8 | 1,013.3 | 1,283.7 | 1,626.3 |
| Inventories, % | 12.69 | 8.61 | 11.75 | 13.34 | 9.35 | 11.15 | 11.15 | 11.15 | 11.15 | 11.15 |
| Accounts Payable | 235.2 | 437.5 | 598.6 | 1,019.1 | 914.6 | 1,021.7 | 1,294.3 | 1,639.8 | 2,077.4 | 2,631.8 |
| Accounts Payable, % | 12.5 | 13.53 | 16.44 | 27.27 | 20.46 | 18.04 | 18.04 | 18.04 | 18.04 | 18.04 |
| Capital Expenditure | -215.9 | -330.5 | -566.7 | -905.5 | -544.9 | -834.6 | -1,057.3 | -1,339.5 | -1,697.0 | -2,149.9 |
| Capital Expenditure, % | -11.48 | -10.22 | -15.57 | -24.23 | -12.19 | -14.74 | -14.74 | -14.74 | -14.74 | -14.74 |
| Tax Rate, % | -0.22807 | -0.22807 | -0.22807 | -0.22807 | -0.22807 | -0.22807 | -0.22807 | -0.22807 | -0.22807 | -0.22807 |
| EBITAT | 189.0 | 365.1 | 466.1 | 403.3 | 276.5 | 585.0 | 741.1 | 938.9 | 1,189.4 | 1,506.9 |
| Depreciation | ||||||||||
| Changes in Account Receivables | ||||||||||
| Changes in Inventories | ||||||||||
| Changes in Accounts Payable | ||||||||||
| Capital Expenditure | ||||||||||
| UFCF | -695.1 | 6.8 | 39.1 | 78.9 | -285.3 | -461.5 | -288.3 | -365.3 | -462.8 | -586.3 |
| WACC, % | 7.27 | 7.27 | 7.28 | 7.29 | 7.33 | 7.29 | 7.29 | 7.29 | 7.29 | 7.29 |
| PV UFCF | ||||||||||
| SUM PV UFCF | -1,738.1 | |||||||||
| Long Term Growth Rate, % | 3.50 | |||||||||
| Free cash flow (T + 1) | -607 | |||||||||
| Terminal Value | -16,016 | |||||||||
| Present Terminal Value | -11,266 | |||||||||
| Enterprise Value | -13,004 | |||||||||
| Net Debt | 2,018 | |||||||||
| Equity Value | -15,023 | |||||||||
| Diluted Shares Outstanding, MM | 953 | |||||||||
| Equity Value Per Share | -15.77 |
What You Will Receive
- Comprehensive 601208SS Financial Data: Access to historical and projected figures for precise valuation.
- Customizable Variables: Adjust WACC, tax rates, revenue growth, and capital investments as needed.
- Real-Time Calculations: Dynamic calculations for intrinsic value and NPV.
- Scenario Analysis: Explore various scenarios to assess Sichuan Em Technology Co., Ltd.'s future performance.
- User-Friendly Interface: Designed for professionals while remaining approachable for newcomers.
Key Features
- Customizable Forecast Settings: Adjust essential parameters such as revenue growth, EBITDA %, and capital expenditures tailored for Sichuan Em Technology Co., Ltd. (601208SS).
- Instant DCF Valuation: Quickly computes intrinsic value, NPV, and other financial metrics with just a few clicks.
- Industry-Leading Precision: Leverages Sichuan Em Technology’s real-world financial data to deliver accurate valuation results.
- Simplified Scenario Analysis: Effortlessly test varying assumptions and evaluate different outcomes side by side.
- Efficiency-Driven Tool: Remove the hassle of creating intricate valuation models from the ground up.
How It Works
- Download: Get instant access to the comprehensive Excel file containing Sichuan Em Technology Co., Ltd.'s (601208SS) financial data.
- Customize: Tailor your forecasts by modifying parameters such as revenue growth, EBITDA percentage, and WACC.
- Update Automatically: Watch as intrinsic value and NPV calculations refresh in real-time.
- Test Scenarios: Develop various projections and instantly compare the outcomes.
- Make Decisions: Leverage the valuation results to inform your investment strategies.
Why Opt for Sichuan Em Technology Co., Ltd. (601208SS) Calculator?
- Reliable Insights: Utilize actual financials from Sichuan Em Technology for trustworthy evaluation outcomes.
- Tailored Options: Modify essential variables such as growth rates, WACC, and tax rates to align with your forecasts.
- Efficiency Boost: Pre-defined calculations save you the hassle of building from the ground up.
- Expert-Level Tool: Crafted for investors, analysts, and consultants alike.
- Accessible Interface: User-friendly design with clear, step-by-step guidance for everyone.
Who Can Benefit From This Product?
- Investors: Assess the valuation of Sichuan Em Technology Co., Ltd. (601208SS) before making investment decisions.
- CFOs and Financial Analysts: Optimize valuation methodologies and evaluate financial forecasts.
- Startup Founders: Gain insights into how established companies like Sichuan Em Technology are valued in the market.
- Consultants: Create comprehensive valuation reports for your clients based on Sichuan Em Technology Co., Ltd. (601208SS).
- Students and Educators: Utilize actual data to enhance the learning and teaching of valuation strategies.
Contents of the Template
- In-Depth DCF Model: Fully editable template featuring comprehensive valuation calculations.
- Real-World Data: Sichuan Em Technology Co., Ltd.'s (601208SS) historical and forecasted financials incorporated for in-depth analysis.
- Adjustable Parameters: Modify WACC, growth rates, and tax assumptions to explore various scenarios.
- Financial Statements: Detailed annual and quarterly financial breakdowns for enhanced insights.
- Key Ratios: Integrated analysis for profitability, operational efficiency, and financial leverage.
- Visual Dashboard: Informed visual outputs including charts and tables for straightforward, actionable results.
Disclaimer
All information, articles, and product details provided on this website are for general informational and educational purposes only. We do not claim any ownership over, nor do we intend to infringe upon, any trademarks, copyrights, logos, brand names, or other intellectual property mentioned or depicted on this site. Such intellectual property remains the property of its respective owners, and any references here are made solely for identification or informational purposes, without implying any affiliation, endorsement, or partnership.
We make no representations or warranties, express or implied, regarding the accuracy, completeness, or suitability of any content or products presented. Nothing on this website should be construed as legal, tax, investment, financial, medical, or other professional advice. In addition, no part of this site—including articles or product references—constitutes a solicitation, recommendation, endorsement, advertisement, or offer to buy or sell any securities, franchises, or other financial instruments, particularly in jurisdictions where such activity would be unlawful.
All content is of a general nature and may not address the specific circumstances of any individual or entity. It is not a substitute for professional advice or services. Any actions you take based on the information provided here are strictly at your own risk. You accept full responsibility for any decisions or outcomes arising from your use of this website and agree to release us from any liability in connection with your use of, or reliance upon, the content or products found herein.