
|
Shaanxi Coal Industry Company Limited (601225.SS) Valoración de DCF |
Completamente Editable: Adáptelo A Sus Necesidades En Excel O Sheets
Diseño Profesional: Plantillas Confiables Y Estándares De La Industria
Predeterminadas Para Un Uso Rápido Y Eficiente
Compatible con MAC / PC, completamente desbloqueado
No Se Necesita Experiencia; Fáciles De Seguir
Shaanxi Coal Industry Company Limited (601225.SS) Bundle
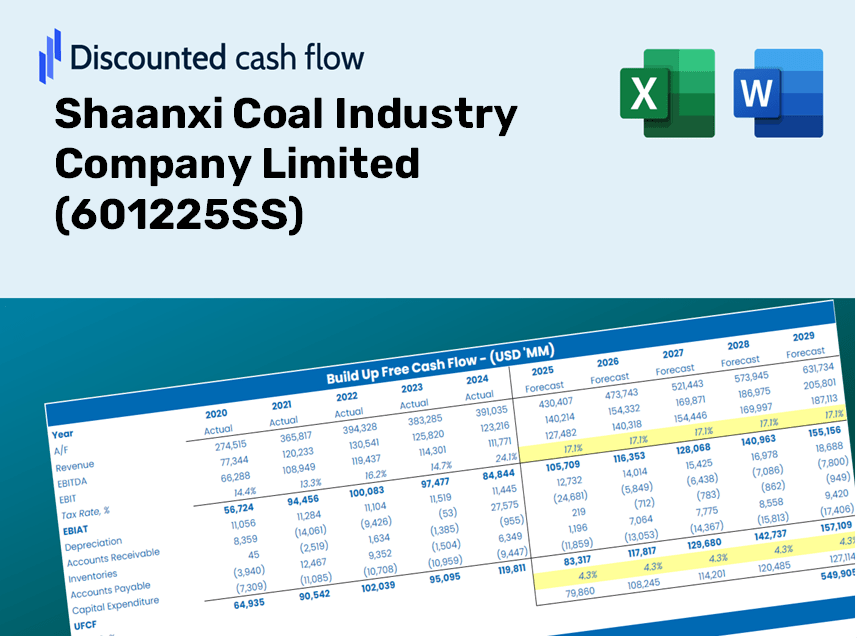
¡Domine su análisis de valoración Shaanxi Coal Industry Company (601225SS) utilizando nuestra sofisticada calculadora DCF! Prelabastados con datos reales (601225SS), esta plantilla de Excel le permite ajustar preventos y supuestos para un cálculo preciso del valor intrínseco de Shaanxi Coal Industry Company Limited.
Benefits You Will Receive
- Authentic 601225SS Financial Data: Access both historical and projected metrics to ensure precise valuation.
- Customizable Parameters: Adjust WACC, tax rates, revenue growth, and capital expenditures to fit your analysis.
- Automated Calculations: Instantly calculate intrinsic value and NPV based on your inputs.
- Comprehensive Scenario Analysis: Explore various scenarios to assess the future performance of Shaanxi Coal Industry Company Limited.
- User-Friendly and Professional Design: Tailored for industry experts while remaining easy to navigate for novices.
Key Features
- Comprehensive DCF Calculator: Offers detailed unlevered and levered DCF valuation models tailored for Shaanxi Coal Industry Company Limited (601225SS).
- WACC Calculator: Pre-configured Weighted Average Cost of Capital template with adjustable inputs specific to the coal industry.
- Customizable Forecast Assumptions: Adjust growth projections, capital investments, and discount rates to fit your analysis.
- Integrated Financial Ratios: Examine profitability, leverage, and operational efficiency ratios for Shaanxi Coal Industry Company Limited (601225SS).
- User-Friendly Dashboard and Charts: Visual representations of essential valuation metrics simplify data analysis.
How It Works
- Download: Obtain the pre-configured Excel file containing financial data for Shaanxi Coal Industry Company Limited (601225SS).
- Customize: Tailor your forecasts, adjusting factors like revenue growth, EBITDA percentage, and WACC.
- Update Automatically: Watch as intrinsic value and NPV calculations refresh in real-time.
- Test Scenarios: Generate various projections and instantly evaluate different outcomes.
- Make Decisions: Leverage the valuation results to inform your investment choices.
Why Opt for This Calculator?
- Save Valuable Time: There's no need to build a DCF model from the ground up – it's ready for immediate use.
- Enhance Accuracy: Dependable financial data and calculations minimize valuation errors.
- Completely Customizable: Adjust the model to align with your unique assumptions and forecasts.
- Simple to Understand: Clear graphs and outputs facilitate easy result analysis.
- Endorsed by Professionals: Created for experts who prioritize precision and user-friendliness.
Who Can Benefit from This Product?
- Finance Students: Master valuation methodologies and implement them with actual data.
- Researchers: Utilize industry-standard models for your academic projects or studies.
- Investors: Evaluate your hypotheses and dissect valuation results for Shaanxi Coal Industry Company Limited (601225SS).
- Analysts: Enhance your efficiency with a customizable and ready-to-use DCF model.
- Entrepreneurs: Discover how major public entities like Shaanxi Coal Industry Company Limited (601225SS) are assessed in the market.
Contents of the Template
- Comprehensive DCF Model: An editable template featuring thorough valuation calculations.
- Real-World Data: Shaanxi Coal Industry Company's historical and projected financials preloaded for your analysis.
- Customizable Parameters: Modify WACC, growth rates, and tax assumptions to explore various scenarios.
- Financial Statements: Complete annual and quarterly breakdowns for in-depth insights.
- Key Ratios: Integrated analysis for assessing profitability, efficiency, and leverage.
- Dashboard with Visual Outputs: Clear charts and tables to present actionable results.
Disclaimer
All information, articles, and product details provided on this website are for general informational and educational purposes only. We do not claim any ownership over, nor do we intend to infringe upon, any trademarks, copyrights, logos, brand names, or other intellectual property mentioned or depicted on this site. Such intellectual property remains the property of its respective owners, and any references here are made solely for identification or informational purposes, without implying any affiliation, endorsement, or partnership.
We make no representations or warranties, express or implied, regarding the accuracy, completeness, or suitability of any content or products presented. Nothing on this website should be construed as legal, tax, investment, financial, medical, or other professional advice. In addition, no part of this site—including articles or product references—constitutes a solicitation, recommendation, endorsement, advertisement, or offer to buy or sell any securities, franchises, or other financial instruments, particularly in jurisdictions where such activity would be unlawful.
All content is of a general nature and may not address the specific circumstances of any individual or entity. It is not a substitute for professional advice or services. Any actions you take based on the information provided here are strictly at your own risk. You accept full responsibility for any decisions or outcomes arising from your use of this website and agree to release us from any liability in connection with your use of, or reliance upon, the content or products found herein.