
|
Banco de Shanghai Co., Ltd. (601229.ss) Valoración de DCF |
Completamente Editable: Adáptelo A Sus Necesidades En Excel O Sheets
Diseño Profesional: Plantillas Confiables Y Estándares De La Industria
Predeterminadas Para Un Uso Rápido Y Eficiente
Compatible con MAC / PC, completamente desbloqueado
No Se Necesita Experiencia; Fáciles De Seguir
Bank of Shanghai Co., Ltd. (601229.SS) Bundle
Desbloquee Bank of Shanghai Co., Ltd. (601229SS) ¡Valor verdadero con nuestra calculadora DCF de grado profesional! Modifique los supuestos clave, explore varios escenarios y analice cómo los cambios afectan a Bank of Shanghai Co., Ltd. (601229SS) Valoración: todo dentro de una sola plantilla de Excel.
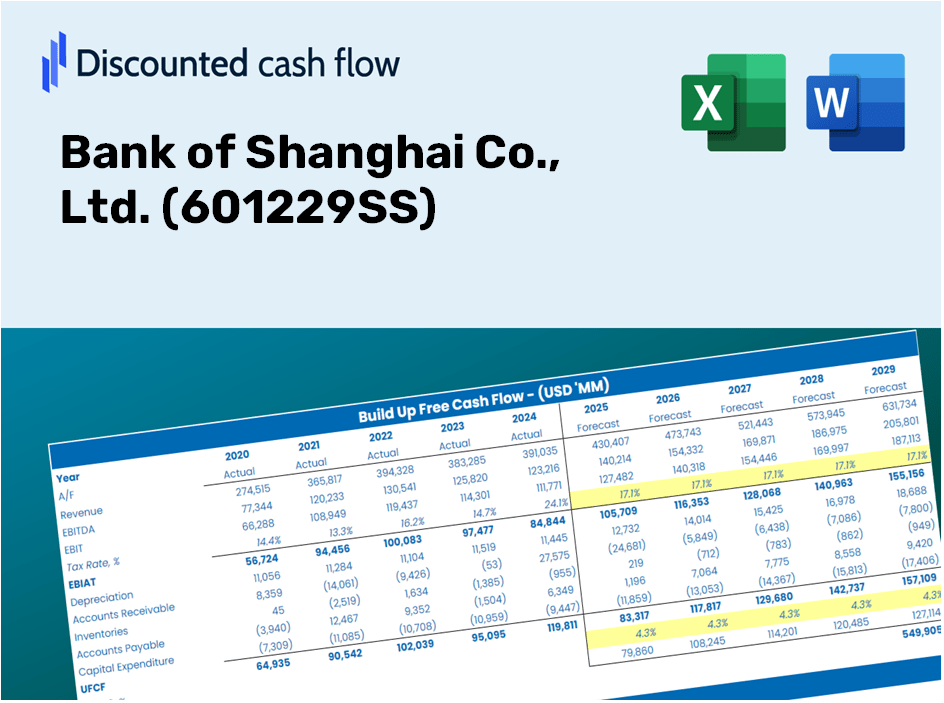
Discounted Cash Flow (DCF) - (USD MM)
| Year | AY1 2020 |
AY2 2021 |
AY3 2022 |
AY4 2023 |
AY5 2024 |
FY1 2025 |
FY2 2026 |
FY3 2027 |
FY4 2028 |
FY5 2029 |
|---|---|---|---|---|---|---|---|---|---|---|
| Revenue | 32,386.1 | 36,194.0 | 107,495.7 | 39,130.4 | 111,580.1 | 152,909.3 | 209,546.8 | 287,162.8 | 393,527.8 | 539,290.3 |
| Revenue Growth, % | 0 | 11.76 | 197 | -63.6 | 185.15 | 37.04 | 37.04 | 37.04 | 37.04 | 37.04 |
| EBITDA | 22,978.6 | 25,046.9 | .0 | 27,666.6 | .0 | 64,484.1 | 88,369.0 | 121,100.9 | 165,956.6 | 227,426.8 |
| EBITDA, % | 70.95 | 69.2 | 0 | 70.7 | 0 | 42.17 | 42.17 | 42.17 | 42.17 | 42.17 |
| Depreciation | 608.8 | 1,520.1 | 1,703.8 | 1,866.4 | 2,042.7 | 4,362.4 | 5,978.3 | 8,192.6 | 11,227.2 | 15,385.7 |
| Depreciation, % | 1.88 | 4.2 | 1.58 | 4.77 | 1.83 | 2.85 | 2.85 | 2.85 | 2.85 | 2.85 |
| EBIT | 22,369.8 | 23,526.9 | -1,703.8 | 25,800.3 | -2,042.7 | 60,121.7 | 82,390.8 | 112,908.3 | 154,729.4 | 212,041.1 |
| EBIT, % | 69.07 | 65 | -1.58 | 65.93 | -1.83 | 39.32 | 39.32 | 39.32 | 39.32 | 39.32 |
| Total Cash | 348,949.3 | 358,107.2 | 372,755.0 | 39,173.9 | 394,833.3 | 152,909.3 | 209,546.8 | 287,162.8 | 393,527.8 | 539,290.3 |
| Total Cash, percent | .0 | .0 | .0 | .0 | .0 | .0 | .0 | .0 | .0 | .0 |
| Account Receivables | .0 | .0 | .0 | .0 | .0 | .0 | .0 | .0 | .0 | .0 |
| Account Receivables, % | 0 | 0 | 0 | 0 | 0 | 0 | 0 | 0 | 0 | 0 |
| Inventories | .0 | .0 | .0 | .0 | .0 | .0 | .0 | .0 | .0 | .0 |
| Inventories, % | 0 | 0 | 0 | 0 | 0 | 0 | 0 | 0 | 0 | 0 |
| Accounts Payable | .0 | .0 | .0 | .0 | .0 | .0 | .0 | .0 | .0 | .0 |
| Accounts Payable, % | 0 | 0 | 0 | 0 | 0 | 0 | 0 | 0 | 0 | 0 |
| Capital Expenditure | -1,128.2 | -958.5 | -689.4 | -1,153.9 | -1,175.8 | -3,295.4 | -4,516.1 | -6,188.8 | -8,481.2 | -11,622.6 |
| Capital Expenditure, % | -3.48 | -2.65 | -0.6413 | -2.95 | -1.05 | -2.16 | -2.16 | -2.16 | -2.16 | -2.16 |
| Tax Rate, % | 12.81 | 12.81 | 12.81 | 12.81 | 12.81 | 12.81 | 12.81 | 12.81 | 12.81 | 12.81 |
| EBITAT | 20,847.6 | 22,016.5 | -1,578.8 | 22,460.5 | -1,781.1 | 54,552.9 | 74,759.2 | 102,450.0 | 140,397.5 | 192,400.6 |
| Depreciation | ||||||||||
| Changes in Account Receivables | ||||||||||
| Changes in Inventories | ||||||||||
| Changes in Accounts Payable | ||||||||||
| Capital Expenditure | ||||||||||
| UFCF | 20,328.2 | 22,578.0 | -564.4 | 23,173.0 | -914.2 | 55,619.9 | 76,221.4 | 104,453.8 | 143,143.5 | 196,163.7 |
| WACC, % | 4.61 | 4.63 | 4.59 | 4.34 | 4.35 | 4.5 | 4.5 | 4.5 | 4.5 | 4.5 |
| PV UFCF | ||||||||||
| SUM PV UFCF | 491,941.6 | |||||||||
| Long Term Growth Rate, % | 2.00 | |||||||||
| Free cash flow (T + 1) | 200,087 | |||||||||
| Terminal Value | 7,991,873 | |||||||||
| Present Terminal Value | 6,411,973 | |||||||||
| Enterprise Value | 6,903,914 | |||||||||
| Net Debt | -394,833 | |||||||||
| Equity Value | 7,298,747 | |||||||||
| Diluted Shares Outstanding, MM | 16,361 | |||||||||
| Equity Value Per Share | 446.11 |
Benefits You Will Receive
- Comprehensive Financial Model: Leverage Bank of Shanghai’s actual data for accurate DCF valuation.
- Complete Forecasting Control: Modify revenue growth, profit margins, WACC, and other critical inputs.
- Real-Time Calculations: Immediate updates provide you with results as adjustments are made.
- Professional-Grade Template: A polished Excel file tailored for sophisticated valuation purposes.
- Flexible and Reusable: Designed for adaptability, allowing multiple uses for in-depth forecasting.
Key Features
- Accurate Bank Financials: Gain access to reliable historical data and future forecasts for Bank of Shanghai Co., Ltd. (601229SS).
- Adjustable Forecast Parameters: Modify highlighted fields for metrics such as WACC, growth rates, and operating margins.
- Real-Time Calculations: Enjoy automatic updates for DCF, Net Present Value (NPV), and cash flow assessments.
- User-Friendly Dashboard: Benefit from clear charts and summaries that illustrate your valuation outcomes.
- Designed for All Levels: An intuitive layout suitable for investors, CFOs, and financial consultants alike.
How It Works
- Step 1: Download the Excel file for Bank of Shanghai Co., Ltd. (601229SS).
- Step 2: Examine the pre-populated financial data and projections for Bank of Shanghai.
- Step 3: Adjust key variables such as revenue growth, WACC, and tax rates (cells marked for editing).
- Step 4: Observe the DCF model refresh in real-time as you modify your assumptions.
- Step 5: Evaluate the results and leverage them for your investment choices.
Why Opt for This Calculator?
- Reliable Data: Access genuine financials from Bank of Shanghai Co., Ltd. (601229SS) for trustworthy valuation outcomes.
- Flexible Customization: Modify essential parameters such as growth rates, WACC, and tax rates to align with your forecasts.
- Efficient: Built-in calculations save you the hassle of starting from square one.
- Professional-Grade Resource: Tailored for investors, analysts, and consultants alike.
- Easy to Use: Designed with an intuitive layout and straightforward instructions for all users.
Who Can Benefit from This Product?
- Institutional Investors: Develop comprehensive valuation models for in-depth portfolio assessment of Bank of Shanghai Co., Ltd. (601229SS).
- Corporate Finance Professionals: Evaluate valuation scenarios to inform strategic decisions within their organizations.
- Financial Consultants and Advisors: Deliver precise valuation analysis for clients interested in Bank of Shanghai Co., Ltd. (601229SS).
- Students and Academic Instructors: Utilize authentic data to practice and teach financial modeling techniques.
- Finance Enthusiasts: Gain insights into the market valuation of key financial institutions like Bank of Shanghai Co., Ltd. (601229SS).
Contents of the Template
- Preloaded BOCI Data: Historical and projected financial information, including revenue, EBIT, and capital expenditures.
- DCF and WACC Models: Advanced sheets designed to calculate intrinsic value and Weighted Average Cost of Capital.
- Editable Inputs: Cells highlighted in yellow for customizing revenue growth, tax rates, and discount rates.
- Financial Statements: Detailed annual and quarterly financials for in-depth analysis.
- Key Ratios: Metrics for profitability, leverage, and efficiency to assess performance.
- Dashboard and Charts: Visual representations of valuation results and underlying assumptions.
Disclaimer
All information, articles, and product details provided on this website are for general informational and educational purposes only. We do not claim any ownership over, nor do we intend to infringe upon, any trademarks, copyrights, logos, brand names, or other intellectual property mentioned or depicted on this site. Such intellectual property remains the property of its respective owners, and any references here are made solely for identification or informational purposes, without implying any affiliation, endorsement, or partnership.
We make no representations or warranties, express or implied, regarding the accuracy, completeness, or suitability of any content or products presented. Nothing on this website should be construed as legal, tax, investment, financial, medical, or other professional advice. In addition, no part of this site—including articles or product references—constitutes a solicitation, recommendation, endorsement, advertisement, or offer to buy or sell any securities, franchises, or other financial instruments, particularly in jurisdictions where such activity would be unlawful.
All content is of a general nature and may not address the specific circumstances of any individual or entity. It is not a substitute for professional advice or services. Any actions you take based on the information provided here are strictly at your own risk. You accept full responsibility for any decisions or outcomes arising from your use of this website and agree to release us from any liability in connection with your use of, or reliance upon, the content or products found herein.