
|
360 Security Technology Inc. (601360.ss) Valoración de DCF |
Completamente Editable: Adáptelo A Sus Necesidades En Excel O Sheets
Diseño Profesional: Plantillas Confiables Y Estándares De La Industria
Predeterminadas Para Un Uso Rápido Y Eficiente
Compatible con MAC / PC, completamente desbloqueado
No Se Necesita Experiencia; Fáciles De Seguir
360 Security Technology Inc. (601360.SS) Bundle
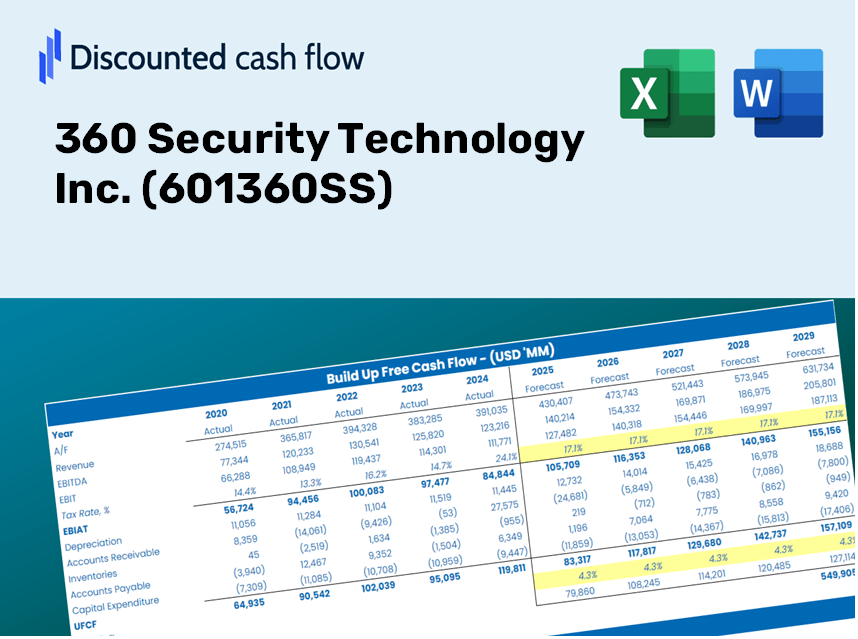
¡Obtenga información sobre su análisis de valoración 360 Security Technology Inc. (601360SS) utilizando nuestra calculadora DCF de vanguardia! Equipado con datos reales (601360SS), esta plantilla de Excel le permite ajustar los pronósticos y supuestos para determinar con precisión el valor intrínseco de 360 Security Technology Inc.
Discounted Cash Flow (DCF) - (USD MM)
| Year | AY1 2020 |
AY2 2021 |
AY3 2022 |
AY4 2023 |
AY5 2024 |
FY1 2025 |
FY2 2026 |
FY3 2027 |
FY4 2028 |
FY5 2029 |
|---|---|---|---|---|---|---|---|---|---|---|
| Revenue | 11,614.7 | 10,885.8 | 9,520.8 | 9,055.4 | 7,947.7 | 7,233.7 | 6,583.8 | 5,992.3 | 5,453.9 | 4,964.0 |
| Revenue Growth, % | 0 | -6.28 | -12.54 | -4.89 | -12.23 | -8.98 | -8.98 | -8.98 | -8.98 | -8.98 |
| EBITDA | 2,388.7 | 903.8 | -480.3 | -59.6 | -426.8 | 257.4 | 234.3 | 213.3 | 194.1 | 176.7 |
| EBITDA, % | 20.57 | 8.3 | -5.05 | -0.65771 | -5.37 | 3.56 | 3.56 | 3.56 | 3.56 | 3.56 |
| Depreciation | 307.2 | 349.5 | 352.8 | 381.3 | 445.5 | 280.3 | 255.1 | 232.2 | 211.4 | 192.4 |
| Depreciation, % | 2.64 | 3.21 | 3.71 | 4.21 | 5.61 | 3.88 | 3.88 | 3.88 | 3.88 | 3.88 |
| EBIT | 2,081.5 | 554.2 | -833.1 | -440.8 | -872.3 | -22.9 | -20.8 | -19.0 | -17.3 | -15.7 |
| EBIT, % | 17.92 | 5.09 | -8.75 | -4.87 | -10.98 | -0.31632 | -0.31632 | -0.31632 | -0.31632 | -0.31632 |
| Total Cash | 26,578.5 | 21,881.7 | 23,285.8 | 26,839.1 | 24,361.3 | 7,233.7 | 6,583.8 | 5,992.3 | 5,453.9 | 4,964.0 |
| Total Cash, percent | .0 | .0 | .0 | .0 | .0 | .0 | .0 | .0 | .0 | .0 |
| Account Receivables | 2,554.9 | 2,904.0 | 1,992.8 | 1,589.1 | 1,487.8 | 1,531.7 | 1,394.1 | 1,268.9 | 1,154.9 | 1,051.1 |
| Account Receivables, % | 22 | 26.68 | 20.93 | 17.55 | 18.72 | 21.17 | 21.17 | 21.17 | 21.17 | 21.17 |
| Inventories | 406.6 | 675.3 | 538.2 | 364.0 | 328.9 | 340.2 | 309.6 | 281.8 | 256.5 | 233.5 |
| Inventories, % | 3.5 | 6.2 | 5.65 | 4.02 | 4.14 | 4.7 | 4.7 | 4.7 | 4.7 | 4.7 |
| Accounts Payable | 2,145.2 | 2,141.7 | 2,205.5 | 2,166.6 | 1,786.9 | 1,558.4 | 1,418.4 | 1,291.0 | 1,175.0 | 1,069.4 |
| Accounts Payable, % | 18.47 | 19.67 | 23.16 | 23.93 | 22.48 | 21.54 | 21.54 | 21.54 | 21.54 | 21.54 |
| Capital Expenditure | -557.7 | -384.4 | -453.9 | -501.1 | -758.7 | -407.7 | -371.1 | -337.7 | -307.4 | -279.8 |
| Capital Expenditure, % | -4.8 | -3.53 | -4.77 | -5.53 | -9.55 | -5.64 | -5.64 | -5.64 | -5.64 | -5.64 |
| Tax Rate, % | -12.27 | -12.27 | -12.27 | -12.27 | -12.27 | -12.27 | -12.27 | -12.27 | -12.27 | -12.27 |
| EBITAT | 1,796.6 | 406.2 | -960.5 | -1,129.1 | -979.3 | -21.0 | -19.1 | -17.4 | -15.9 | -14.4 |
| Depreciation | ||||||||||
| Changes in Account Receivables | ||||||||||
| Changes in Inventories | ||||||||||
| Changes in Accounts Payable | ||||||||||
| Capital Expenditure | ||||||||||
| UFCF | 729.8 | -250.0 | 50.3 | -709.9 | -1,535.8 | -432.1 | -106.9 | -97.3 | -88.6 | -80.6 |
| WACC, % | 5.19 | 5.18 | 5.2 | 5.2 | 5.2 | 5.19 | 5.19 | 5.19 | 5.19 | 5.19 |
| PV UFCF | ||||||||||
| SUM PV UFCF | -725.8 | |||||||||
| Long Term Growth Rate, % | 4.00 | |||||||||
| Free cash flow (T + 1) | -84 | |||||||||
| Terminal Value | -7,023 | |||||||||
| Present Terminal Value | -5,452 | |||||||||
| Enterprise Value | -6,178 | |||||||||
| Net Debt | -22,603 | |||||||||
| Equity Value | 16,425 | |||||||||
| Diluted Shares Outstanding, MM | 6,836 | |||||||||
| Equity Value Per Share | 2.40 |
Benefits of Choosing 360 Security Technology Inc. (601360SS)
- Comprehensive Financial Model: Leverage 360 Security’s real data for accurate DCF valuation.
- Complete Forecast Control: Modify revenue growth, profit margins, WACC, and other essential metrics.
- Real-Time Calculations: Enjoy automatic updates to view outcomes as you implement changes.
- Professional-Grade Template: An expertly crafted Excel file designed for high-quality valuation processes.
- Flexible and Reusable: Customizable to ensure ease of use for creating detailed forecasts repeatedly.
Key Features
- Comprehensive DCF Calculator: Features in-depth unlevered and levered DCF valuation frameworks.
- WACC Calculator: Includes a pre-configured Weighted Average Cost of Capital template with adjustable parameters.
- Customizable Forecast Assumptions: Easily alter growth projections, capital expenditures, and discount rates.
- Integrated Financial Ratios: Examine profitability, leverage, and efficiency ratios tailored for 360 Security Technology Inc. (601360SS).
- Intuitive Dashboard and Charts: Visual representations encapsulate essential valuation indicators for straightforward analysis.
How It Works
- Step 1: Download the Excel file for 360 Security Technology Inc. (601360SS).
- Step 2: Review the pre-filled financial data and forecasts provided for 360 Security Technology Inc. (601360SS).
- Step 3: Adjust key inputs such as revenue growth, WACC, and tax rates (highlighted cells) to fit your analysis.
- Step 4: Observe the DCF model update in real-time as you modify your assumptions.
- Step 5: Evaluate the outputs generated and leverage the insights for your investment strategies.
Why Opt for 360 Security Technology Inc. Calculator?
- Reliable Data: Access to authentic financials from 360 Security Technology Inc. ensures dependable valuation outcomes.
- Highly Customizable: Tailor critical parameters such as growth rates, WACC, and tax rates to align with your forecasts.
- Efficient: Built-in calculations save you the hassle of starting from the ground up.
- Professional Quality: Crafted for investors, analysts, and consultants seeking precision.
- Easy to Use: User-friendly interface and clear, step-by-step guidance make it accessible for everyone.
Who Can Benefit from 360 Security Technology Inc. (601360SS)?
- Cybersecurity Students: Explore advanced security measures and apply them using real-world scenarios.
- Researchers: Integrate industry-standard models and practices into your studies or publications.
- Investors: Validate your investment strategies and analyze the financial performance of 360 Security Technology Inc. (601360SS).
- Security Analysts: Enhance your analysis with a customizable risk assessment model tailored for security technologies.
- Small Business Owners: Discover how leading security firms like 360 Security Technology Inc. (601360SS) manage their security solutions.
Contents of the Template
- Pre-Filled DCF Model: Financial data for 360 Security Technology Inc. preloaded for immediate application.
- WACC Calculator: Comprehensive calculations for the Weighted Average Cost of Capital.
- Financial Ratios: Assess 360 Security Technology’s profitability, leverage, and operational efficiency.
- Editable Inputs: Modify assumptions such as growth rates, profit margins, and capital expenditures to suit your analysis.
- Financial Statements: Access annual and quarterly reports for in-depth analysis.
- Interactive Dashboard: Effortlessly visualize essential valuation metrics and outcomes.
Disclaimer
All information, articles, and product details provided on this website are for general informational and educational purposes only. We do not claim any ownership over, nor do we intend to infringe upon, any trademarks, copyrights, logos, brand names, or other intellectual property mentioned or depicted on this site. Such intellectual property remains the property of its respective owners, and any references here are made solely for identification or informational purposes, without implying any affiliation, endorsement, or partnership.
We make no representations or warranties, express or implied, regarding the accuracy, completeness, or suitability of any content or products presented. Nothing on this website should be construed as legal, tax, investment, financial, medical, or other professional advice. In addition, no part of this site—including articles or product references—constitutes a solicitation, recommendation, endorsement, advertisement, or offer to buy or sell any securities, franchises, or other financial instruments, particularly in jurisdictions where such activity would be unlawful.
All content is of a general nature and may not address the specific circumstances of any individual or entity. It is not a substitute for professional advice or services. Any actions you take based on the information provided here are strictly at your own risk. You accept full responsibility for any decisions or outcomes arising from your use of this website and agree to release us from any liability in connection with your use of, or reliance upon, the content or products found herein.