
|
China-Singapore Suzhou Industrial Park Development Group Co., Ltd. (601512.ss) Valoración de DCF |
Completamente Editable: Adáptelo A Sus Necesidades En Excel O Sheets
Diseño Profesional: Plantillas Confiables Y Estándares De La Industria
Predeterminadas Para Un Uso Rápido Y Eficiente
Compatible con MAC / PC, completamente desbloqueado
No Se Necesita Experiencia; Fáciles De Seguir
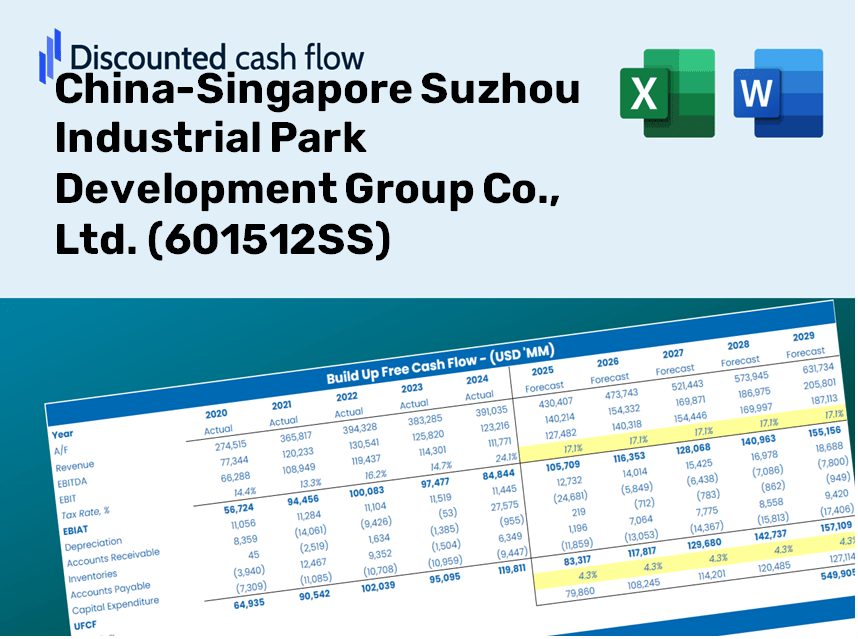
China-Singapore Suzhou Industrial Park Development Group Co., Ltd. (601512.SS) Bundle
¡Explore las perspectivas financieras de China-Singapore Suzhou Industrial Park Development Group Co., Ltd. (601512SS) con nuestra calculadora DCF fácil de usar! Ingrese sus proyecciones para el crecimiento, los márgenes y los gastos para calcular el valor intrínseco de China-Singapore Suzhou Industrial Park Development Group Co., Ltd. (601512ss) y mejorar su estrategia de inversión.
Discounted Cash Flow (DCF) - (USD MM)
| Year | AY1 2020 |
AY2 2021 |
AY3 2022 |
AY4 2023 |
AY5 2024 |
FY1 2025 |
FY2 2026 |
FY3 2027 |
FY4 2028 |
FY5 2029 |
|---|---|---|---|---|---|---|---|---|---|---|
| Revenue | 3,414.1 | 3,917.2 | 4,741.9 | 3,656.6 | 2,685.1 | 2,593.4 | 2,504.8 | 2,419.2 | 2,336.5 | 2,256.7 |
| Revenue Growth, % | 0 | 14.74 | 21.05 | -22.89 | -26.57 | -3.42 | -3.42 | -3.42 | -3.42 | -3.42 |
| EBITDA | 2,185.6 | 2,298.1 | 2,819.2 | 1,787.1 | 1,323.4 | 1,453.8 | 1,404.1 | 1,356.2 | 1,309.8 | 1,265.1 |
| EBITDA, % | 64.02 | 58.67 | 59.45 | 48.87 | 49.29 | 56.06 | 56.06 | 56.06 | 56.06 | 56.06 |
| Depreciation | 334.4 | 358.9 | 370.0 | 399.2 | 456.8 | 283.7 | 274.0 | 264.6 | 255.6 | 246.8 |
| Depreciation, % | 9.79 | 9.16 | 7.8 | 10.92 | 17.01 | 10.94 | 10.94 | 10.94 | 10.94 | 10.94 |
| EBIT | 1,851.2 | 1,939.1 | 2,449.3 | 1,387.9 | 866.6 | 1,170.2 | 1,130.2 | 1,091.6 | 1,054.3 | 1,018.2 |
| EBIT, % | 54.22 | 49.5 | 51.65 | 37.96 | 32.27 | 45.12 | 45.12 | 45.12 | 45.12 | 45.12 |
| Total Cash | 3,952.7 | 3,131.9 | 3,619.7 | 3,869.0 | 3,183.2 | 2,366.6 | 2,285.8 | 2,207.7 | 2,132.3 | 2,059.4 |
| Total Cash, percent | .0 | .0 | .0 | .0 | .0 | .0 | .0 | .0 | .0 | .0 |
| Account Receivables | 1,363.1 | 1,585.9 | 2,689.4 | 2,413.5 | 2,314.2 | 1,500.6 | 1,449.3 | 1,399.8 | 1,352.0 | 1,305.8 |
| Account Receivables, % | 39.92 | 40.49 | 56.72 | 66 | 86.19 | 57.86 | 57.86 | 57.86 | 57.86 | 57.86 |
| Inventories | 8,722.4 | 10,669.1 | 11,009.0 | 11,582.6 | 10,765.8 | 2,593.4 | 2,504.8 | 2,419.2 | 2,336.5 | 2,256.7 |
| Inventories, % | 255.48 | 272.36 | 232.16 | 316.76 | 400.94 | 100 | 100 | 100 | 100 | 100 |
| Accounts Payable | 1,763.4 | 1,921.5 | 1,816.2 | 1,784.9 | 1,597.0 | 1,282.6 | 1,238.8 | 1,196.5 | 1,155.6 | 1,116.1 |
| Accounts Payable, % | 51.65 | 49.05 | 38.3 | 48.81 | 59.48 | 49.46 | 49.46 | 49.46 | 49.46 | 49.46 |
| Capital Expenditure | -811.8 | -927.5 | -723.9 | -951.4 | -748.0 | -604.7 | -584.1 | -564.1 | -544.8 | -526.2 |
| Capital Expenditure, % | -23.78 | -23.68 | -15.27 | -26.02 | -27.86 | -23.32 | -23.32 | -23.32 | -23.32 | -23.32 |
| Tax Rate, % | 23.41 | 23.41 | 23.41 | 23.41 | 23.41 | 23.41 | 23.41 | 23.41 | 23.41 | 23.41 |
| EBITAT | 1,164.7 | 1,174.0 | 1,380.7 | 939.6 | 663.7 | 758.5 | 732.6 | 707.6 | 683.4 | 660.1 |
| Depreciation | ||||||||||
| Changes in Account Receivables | ||||||||||
| Changes in Inventories | ||||||||||
| Changes in Accounts Payable | ||||||||||
| Capital Expenditure | ||||||||||
| UFCF | -7,634.9 | -1,405.9 | -521.9 | 58.5 | 1,100.7 | 9,109.1 | 518.6 | 500.8 | 483.7 | 467.2 |
| WACC, % | 4.26 | 4.23 | 4.18 | 4.32 | 4.43 | 4.28 | 4.28 | 4.28 | 4.28 | 4.28 |
| PV UFCF | ||||||||||
| SUM PV UFCF | 10,441.1 | |||||||||
| Long Term Growth Rate, % | 2.00 | |||||||||
| Free cash flow (T + 1) | 477 | |||||||||
| Terminal Value | 20,863 | |||||||||
| Present Terminal Value | 16,916 | |||||||||
| Enterprise Value | 27,357 | |||||||||
| Net Debt | 4,530 | |||||||||
| Equity Value | 22,827 | |||||||||
| Diluted Shares Outstanding, MM | 1,482 | |||||||||
| Equity Value Per Share | 15.41 |
What You Will Receive
- Authentic (601512SS) Financial Data: Pre-loaded with historical and forecasted data for accurate analysis.
- Customizable Template: Easily adjust key metrics such as revenue growth, WACC, and EBITDA percentages.
- Instant Calculations: Observe real-time updates of (601512SS) intrinsic value as you make changes.
- Expert Valuation Tool: Tailored for investors, analysts, and consultants in need of reliable DCF outcomes.
- Intuitive Interface: Streamlined layout and straightforward instructions suitable for all skill levels.
Key Features
- Real-Time 601512SS Data: Incorporates the historical financials and future projections of China-Singapore Suzhou Industrial Park Development Group Co., Ltd.
- Comprehensive Customization: Modify parameters such as revenue growth, profit margins, discount rates, tax rates, and capital investments.
- Adaptive Valuation Model: Automatically refreshes Net Present Value (NPV) and intrinsic value based on your customized inputs.
- Scenario Analysis: Develop multiple forecasting scenarios to evaluate various valuation possibilities.
- Intuitive User Interface: Designed for both professionals and newcomers, featuring a clear and organized layout.
How It Functions
- Step 1: Download the Excel file for China-Singapore Suzhou Industrial Park Development Group Co., Ltd. (601512SS).
- Step 2: Examine the pre-filled financial data and projections for the company.
- Step 3: Adjust key inputs such as revenue growth, WACC, and tax rates (cells highlighted for your convenience).
- Step 4: Observe the DCF model update in real-time as you modify your assumptions.
- Step 5: Review the outcomes and leverage the findings for your investment strategies.
Why Opt for This Calculator?
- Precise Data: Access to authentic financial information from China-Singapore Suzhou Industrial Park Development Group Co., Ltd. ensures trustworthy valuation outcomes.
- Flexible Customization: Tailor essential variables such as growth rates, WACC, and tax rates to align with your forecasts.
- Efficient: Built-in calculations save you from the hassle of starting from the ground up.
- Professional Quality: Ideal for investors, analysts, and consultants seeking high-level insights.
- Easy to Use: User-friendly design and clear, step-by-step guidance make it accessible for everyone.
Who Can Benefit from This Product?
- Investors: Empower your investment choices with a top-tier valuation tool tailored for informed decision-making.
- Financial Analysts: Enhance your efficiency with a customizable, ready-to-use DCF model.
- Consultants: Seamlessly modify the template for impactful client presentations or detailed reports.
- Finance Enthusiasts: Expand your knowledge of valuation methods through hands-on experience with real-world scenarios.
- Educators and Students: Leverage this tool as a practical aid for finance-related coursework and projects.
Contents of the Template
- Pre-Filled Data: Includes China-Singapore Suzhou Industrial Park Development Group Co., Ltd. (601512SS) historical financials and forecasts.
- Discounted Cash Flow Model: Editable DCF valuation model featuring automatic calculations.
- Weighted Average Cost of Capital (WACC): A dedicated sheet for computing WACC based on user-defined inputs.
- Key Financial Ratios: Examine the profitability, efficiency, and leverage of China-Singapore Suzhou Industrial Park Development Group Co., Ltd. (601512SS).
- Customizable Inputs: Easily modify revenue growth, profit margins, and tax rates.
- User-Friendly Dashboard: Visual representations and tables that summarize essential valuation outcomes.
Disclaimer
All information, articles, and product details provided on this website are for general informational and educational purposes only. We do not claim any ownership over, nor do we intend to infringe upon, any trademarks, copyrights, logos, brand names, or other intellectual property mentioned or depicted on this site. Such intellectual property remains the property of its respective owners, and any references here are made solely for identification or informational purposes, without implying any affiliation, endorsement, or partnership.
We make no representations or warranties, express or implied, regarding the accuracy, completeness, or suitability of any content or products presented. Nothing on this website should be construed as legal, tax, investment, financial, medical, or other professional advice. In addition, no part of this site—including articles or product references—constitutes a solicitation, recommendation, endorsement, advertisement, or offer to buy or sell any securities, franchises, or other financial instruments, particularly in jurisdictions where such activity would be unlawful.
All content is of a general nature and may not address the specific circumstances of any individual or entity. It is not a substitute for professional advice or services. Any actions you take based on the information provided here are strictly at your own risk. You accept full responsibility for any decisions or outcomes arising from your use of this website and agree to release us from any liability in connection with your use of, or reliance upon, the content or products found herein.