
|
Soochow Securities Co., Ltd. (601555.ss) Valoración de DCF |
Completamente Editable: Adáptelo A Sus Necesidades En Excel O Sheets
Diseño Profesional: Plantillas Confiables Y Estándares De La Industria
Predeterminadas Para Un Uso Rápido Y Eficiente
Compatible con MAC / PC, completamente desbloqueado
No Se Necesita Experiencia; Fáciles De Seguir
Soochow Securities Co., Ltd. (601555.SS) Bundle
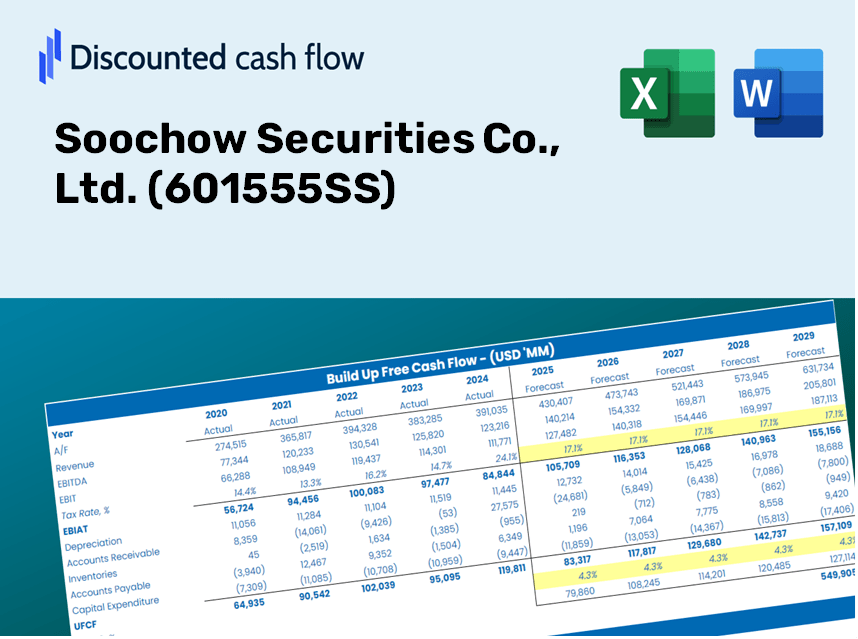
¡Explore Soochow Securities Co., Ltd. (601555SS) Outlook financiero con nuestra calculadora DCF fácil de usar! Ingrese sus suposiciones con respecto al crecimiento, los márgenes y los gastos para calcular el valor intrínseco de Soochow Securities Co., Ltd. (601555ss) e informar sus decisiones de inversión.
Discounted Cash Flow (DCF) - (USD MM)
| Year | AY1 2020 |
AY2 2021 |
AY3 2022 |
AY4 2023 |
AY5 2024 |
FY1 2025 |
FY2 2026 |
FY3 2027 |
FY4 2028 |
FY5 2029 |
|---|---|---|---|---|---|---|---|---|---|---|
| Revenue | 7,314.0 | 11,759.3 | 12,772.7 | 13,953.8 | 11,498.6 | 13,253.5 | 15,276.3 | 17,607.7 | 20,295.0 | 23,392.3 |
| Revenue Growth, % | 0 | 60.78 | 8.62 | 9.25 | -17.6 | 15.26 | 15.26 | 15.26 | 15.26 | 15.26 |
| EBITDA | 4,603.0 | 3,399.5 | 3,438.6 | 4,531.5 | 3,314.5 | 4,773.0 | 5,501.4 | 6,341.1 | 7,308.8 | 8,424.3 |
| EBITDA, % | 62.93 | 28.91 | 26.92 | 32.47 | 28.83 | 36.01 | 36.01 | 36.01 | 36.01 | 36.01 |
| Depreciation | 123.5 | 212.7 | 261.1 | 285.7 | 299.7 | 270.2 | 311.5 | 359.0 | 413.8 | 476.9 |
| Depreciation, % | 1.69 | 1.81 | 2.04 | 2.05 | 2.61 | 2.04 | 2.04 | 2.04 | 2.04 | 2.04 |
| EBIT | 4,479.5 | 3,186.9 | 3,177.5 | 4,245.8 | 3,014.8 | 4,502.8 | 5,190.0 | 5,982.1 | 6,895.0 | 7,947.3 |
| EBIT, % | 61.25 | 27.1 | 24.88 | 30.43 | 26.22 | 33.97 | 33.97 | 33.97 | 33.97 | 33.97 |
| Total Cash | 48,748.7 | 67,172.0 | 56,983.8 | 3,532.3 | 73,244.3 | 11,273.8 | 12,994.4 | 14,977.6 | 17,263.5 | 19,898.2 |
| Total Cash, percent | .0 | .0 | .0 | .0 | .0 | .0 | .0 | .0 | .0 | .0 |
| Account Receivables | 376.9 | 25,021.6 | 126.2 | 25,261.0 | 439.3 | 5,565.5 | 6,414.8 | 7,393.9 | 8,522.3 | 9,823.0 |
| Account Receivables, % | 5.15 | 212.78 | 0.98809 | 181.03 | 3.82 | 41.99 | 41.99 | 41.99 | 41.99 | 41.99 |
| Inventories | 66.2 | 127.5 | 82.6 | 66.5 | .0 | 82.5 | 95.1 | 109.6 | 126.3 | 145.6 |
| Inventories, % | 0.90494 | 1.08 | 0.64656 | 0.47653 | 0 | 0.62242 | 0.62242 | 0.62242 | 0.62242 | 0.62242 |
| Accounts Payable | 405.0 | 611.6 | 684.9 | 404.6 | 272.7 | 566.5 | 653.0 | 752.6 | 867.5 | 999.9 |
| Accounts Payable, % | 5.54 | 5.2 | 5.36 | 2.9 | 2.37 | 4.27 | 4.27 | 4.27 | 4.27 | 4.27 |
| Capital Expenditure | -1,098.3 | -231.8 | -177.2 | -704.2 | -436.9 | -721.5 | -831.7 | -958.6 | -1,104.9 | -1,273.5 |
| Capital Expenditure, % | -15.02 | -1.97 | -1.39 | -5.05 | -3.8 | -5.44 | -5.44 | -5.44 | -5.44 | -5.44 |
| Tax Rate, % | 21.52 | 21.52 | 21.52 | 21.52 | 21.52 | 21.52 | 21.52 | 21.52 | 21.52 | 21.52 |
| EBITAT | 3,364.1 | 2,391.8 | 2,515.6 | 3,308.7 | 2,366.2 | 3,473.7 | 4,003.9 | 4,615.0 | 5,319.3 | 6,131.1 |
| Depreciation | ||||||||||
| Changes in Account Receivables | ||||||||||
| Changes in Inventories | ||||||||||
| Changes in Accounts Payable | ||||||||||
| Capital Expenditure | ||||||||||
| UFCF | 2,351.3 | -22,126.7 | 27,613.0 | -22,508.8 | 26,985.4 | -1,892.5 | 2,708.2 | 3,121.5 | 3,597.9 | 4,147.0 |
| WACC, % | 4.04 | 4.04 | 4.13 | 4.1 | 4.11 | 4.08 | 4.08 | 4.08 | 4.08 | 4.08 |
| PV UFCF | ||||||||||
| SUM PV UFCF | 9,910.4 | |||||||||
| Long Term Growth Rate, % | 2.00 | |||||||||
| Free cash flow (T + 1) | 4,230 | |||||||||
| Terminal Value | 202,988 | |||||||||
| Present Terminal Value | 166,170 | |||||||||
| Enterprise Value | 176,081 | |||||||||
| Net Debt | 6,228 | |||||||||
| Equity Value | 169,852 | |||||||||
| Diluted Shares Outstanding, MM | 4,930 | |||||||||
| Equity Value Per Share | 34.46 |
Benefits You Will Receive
- Customizable Excel Template: A fully adaptable Excel-based DCF Calculator featuring pre-filled financial data for Soochow Securities Co., Ltd. (601555SS).
- Accurate Market Data: Access to historical financial data and forward-looking estimates (highlighted in the yellow cells).
- Adjustable Forecasts: Modify key assumptions such as revenue growth, EBITDA percentage, and WACC.
- Real-Time Calculations: Quickly assess how your adjustments affect the valuation of Soochow Securities Co., Ltd. (601555SS).
- Professional Financial Tool: Designed for investors, CFOs, consultants, and financial analysts.
- Intuitive Design: Organized for simplicity and ease of use, complete with comprehensive step-by-step instructions.
Key Features
- Accurate Soochow Securities Financials: Gain access to reliable pre-loaded historical data and future forecasts for [601555SS].
- Adjustable Forecast Parameters: Modify highlighted cells for assumptions like WACC, growth rates, and margins easily.
- Real-time Calculations: Instant updates to DCF, Net Present Value (NPV), and cash flow analyses as you make changes.
- User-Friendly Dashboard: Intuitive charts and summaries to help you easily interpret your valuation findings.
- Designed for All Users: A straightforward and accessible format tailored for investors, CFOs, and consultants alike.
How It Works
- Step 1: Download the prebuilt Excel template featuring Soochow Securities Co., Ltd. (601555SS) data.
- Step 2: Navigate through the pre-filled sheets to familiarize yourself with the key performance indicators.
- Step 3: Modify projections and assumptions in the editable yellow cells (WACC, growth, margins).
- Step 4: Instantly see updated results, including the intrinsic value of Soochow Securities Co., Ltd. (601555SS).
- Step 5: Make well-informed investment choices or create reports based on the generated outputs.
Why Choose Soochow Securities Co., Ltd. Calculator?
- Accurate Data: Up-to-date financial information from Soochow Securities ensures dependable valuation insights.
- Customizable: Tailor essential parameters like growth rates, WACC, and tax rates to fit your forecasts.
- Time-Saving: Built-in calculations mean you won't have to start from the ground up.
- Professional-Grade Tool: Crafted for the needs of investors, analysts, and consultants.
- User-Friendly: An intuitive design and clear, step-by-step guidance make it accessible for everyone.
Who Should Benefit from Soochow Securities Co., Ltd. (601555SS)?
- Investors: Gain a precise understanding of the fair value of Soochow Securities Co., Ltd. (601555SS) before making investment choices.
- CFOs: Utilize a high-quality DCF model for comprehensive financial reporting and analysis.
- Consultants: Effortlessly tailor the template for client valuation reports related to Soochow Securities Co., Ltd. (601555SS).
- Entrepreneurs: Discover financial modeling strategies employed by leading firms in the industry.
- Educators: Employ it as an educational resource to illustrate various valuation methods.
Contents of the Template
- Preloaded 601555SS Data: Historical and forecasted financial metrics, including revenue, EBIT, and capital expenditures.
- DCF and WACC Models: Advanced sheets designed for calculating intrinsic value and Weighted Average Cost of Capital.
- Editable Inputs: Yellow-highlighted cells for modifying revenue growth, tax rates, and discount rates.
- Financial Statements: Detailed annual and quarterly financials for thorough analysis.
- Key Ratios: Metrics for profitability, leverage, and efficiency to assess performance.
- Dashboard and Charts: Graphical representations of valuation results and underlying assumptions.
Disclaimer
All information, articles, and product details provided on this website are for general informational and educational purposes only. We do not claim any ownership over, nor do we intend to infringe upon, any trademarks, copyrights, logos, brand names, or other intellectual property mentioned or depicted on this site. Such intellectual property remains the property of its respective owners, and any references here are made solely for identification or informational purposes, without implying any affiliation, endorsement, or partnership.
We make no representations or warranties, express or implied, regarding the accuracy, completeness, or suitability of any content or products presented. Nothing on this website should be construed as legal, tax, investment, financial, medical, or other professional advice. In addition, no part of this site—including articles or product references—constitutes a solicitation, recommendation, endorsement, advertisement, or offer to buy or sell any securities, franchises, or other financial instruments, particularly in jurisdictions where such activity would be unlawful.
All content is of a general nature and may not address the specific circumstances of any individual or entity. It is not a substitute for professional advice or services. Any actions you take based on the information provided here are strictly at your own risk. You accept full responsibility for any decisions or outcomes arising from your use of this website and agree to release us from any liability in connection with your use of, or reliance upon, the content or products found herein.