
|
Shanxi Lu'an Environmental Energy Development Co., Ltd. (601699.ss) Valoración de DCF |
Completamente Editable: Adáptelo A Sus Necesidades En Excel O Sheets
Diseño Profesional: Plantillas Confiables Y Estándares De La Industria
Predeterminadas Para Un Uso Rápido Y Eficiente
Compatible con MAC / PC, completamente desbloqueado
No Se Necesita Experiencia; Fáciles De Seguir
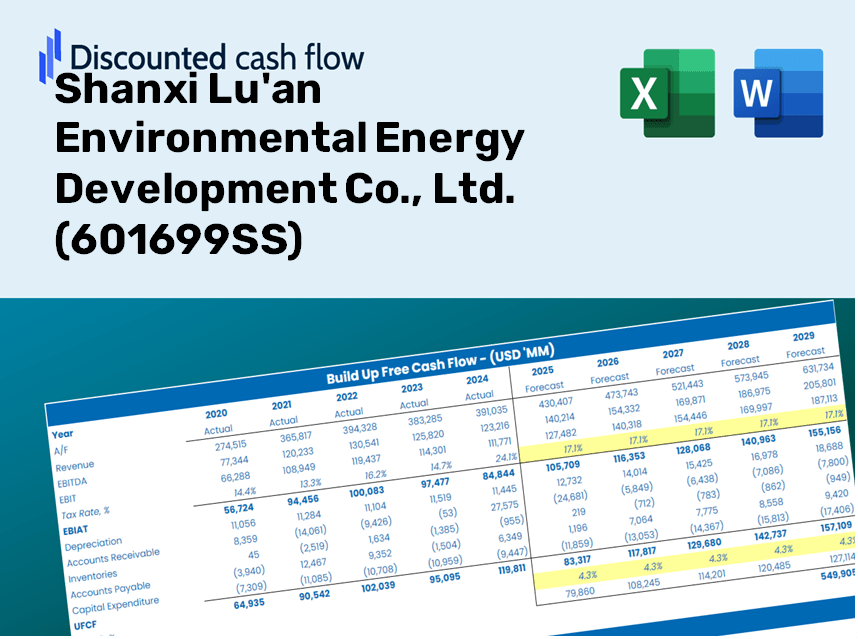
Shanxi Lu'an Environmental Energy Development Co., Ltd. (601699.SS) Bundle
Ya sea que sea un inversor o analista, esta calculadora DCF (601699SS) es su herramienta esencial para una valoración precisa. Precedidos con datos reales de Shanxi Lu'an Environmental Energy Development Co., Ltd., puede ajustar los pronósticos y observar los efectos de inmediato.
Discounted Cash Flow (DCF) - (USD MM)
| Year | AY1 2020 |
AY2 2021 |
AY3 2022 |
AY4 2023 |
AY5 2024 |
FY1 2025 |
FY2 2026 |
FY3 2027 |
FY4 2028 |
FY5 2029 |
|---|---|---|---|---|---|---|---|---|---|---|
| Revenue | 26,047.7 | 45,322.1 | 54,297.1 | 43,137.0 | 35,850.3 | 34,419.0 | 33,044.8 | 31,725.5 | 30,458.9 | 29,242.9 |
| Revenue Growth, % | 0 | 74 | 19.8 | -20.55 | -16.89 | -3.99 | -3.99 | -3.99 | -3.99 | -3.99 |
| EBITDA | 5,570.3 | 16,706.5 | 24,576.3 | 15,054.5 | 6,817.0 | 10,836.7 | 10,404.1 | 9,988.7 | 9,589.9 | 9,207.1 |
| EBITDA, % | 21.39 | 36.86 | 45.26 | 34.9 | 19.02 | 31.48 | 31.48 | 31.48 | 31.48 | 31.48 |
| Depreciation | 2,031.7 | 2,683.1 | 3,406.5 | 3,449.5 | 2,644.2 | 2,434.5 | 2,337.3 | 2,244.0 | 2,154.4 | 2,068.4 |
| Depreciation, % | 7.8 | 5.92 | 6.27 | 8 | 7.38 | 7.07 | 7.07 | 7.07 | 7.07 | 7.07 |
| EBIT | 3,538.7 | 14,023.4 | 21,169.9 | 11,605.0 | 4,172.8 | 8,402.2 | 8,066.8 | 7,744.7 | 7,435.5 | 7,138.7 |
| EBIT, % | 13.59 | 30.94 | 38.99 | 26.9 | 11.64 | 24.41 | 24.41 | 24.41 | 24.41 | 24.41 |
| Total Cash | 16,581.8 | 16,440.0 | 31,090.9 | 26,751.9 | 12,580.5 | 17,505.6 | 16,806.7 | 16,135.7 | 15,491.5 | 14,873.0 |
| Total Cash, percent | .0 | .0 | .0 | .0 | .0 | .0 | .0 | .0 | .0 | .0 |
| Account Receivables | 10,570.9 | 25,664.3 | 13,865.9 | 12,891.0 | 9,845.5 | 12,397.3 | 11,902.3 | 11,427.1 | 10,970.9 | 10,532.9 |
| Account Receivables, % | 40.58 | 56.63 | 25.54 | 29.88 | 27.46 | 36.02 | 36.02 | 36.02 | 36.02 | 36.02 |
| Inventories | 575.1 | 930.4 | 1,203.9 | 1,236.3 | 766.1 | 790.3 | 758.8 | 728.5 | 699.4 | 671.5 |
| Inventories, % | 2.21 | 2.05 | 2.22 | 2.87 | 2.14 | 2.3 | 2.3 | 2.3 | 2.3 | 2.3 |
| Accounts Payable | 17,325.3 | 20,037.9 | 19,511.4 | 16,783.2 | 15,289.9 | 15,710.0 | 15,082.8 | 14,480.6 | 13,902.5 | 13,347.4 |
| Accounts Payable, % | 66.51 | 44.21 | 35.93 | 38.91 | 42.65 | 45.64 | 45.64 | 45.64 | 45.64 | 45.64 |
| Capital Expenditure | -1,159.2 | -2,151.1 | -750.7 | -678.4 | -12,995.7 | -3,331.9 | -3,198.8 | -3,071.1 | -2,948.5 | -2,830.8 |
| Capital Expenditure, % | -4.45 | -4.75 | -1.38 | -1.57 | -36.25 | -9.68 | -9.68 | -9.68 | -9.68 | -9.68 |
| Tax Rate, % | 40.36 | 40.36 | 40.36 | 40.36 | 40.36 | 40.36 | 40.36 | 40.36 | 40.36 | 40.36 |
| EBITAT | 2,569.6 | 10,198.3 | 15,071.1 | 7,883.2 | 2,488.5 | 5,782.3 | 5,551.5 | 5,329.8 | 5,117.0 | 4,912.8 |
| Depreciation | ||||||||||
| Changes in Account Receivables | ||||||||||
| Changes in Inventories | ||||||||||
| Changes in Accounts Payable | ||||||||||
| Capital Expenditure | ||||||||||
| UFCF | 9,621.3 | -2,005.7 | 28,725.3 | 8,868.6 | -5,840.7 | 2,729.1 | 4,589.2 | 4,406.0 | 4,230.1 | 4,061.2 |
| WACC, % | 6.75 | 6.75 | 6.73 | 6.7 | 6.62 | 6.71 | 6.71 | 6.71 | 6.71 | 6.71 |
| PV UFCF | ||||||||||
| SUM PV UFCF | 16,412.4 | |||||||||
| Long Term Growth Rate, % | 0.50 | |||||||||
| Free cash flow (T + 1) | 4,082 | |||||||||
| Terminal Value | 65,750 | |||||||||
| Present Terminal Value | 47,524 | |||||||||
| Enterprise Value | 63,937 | |||||||||
| Net Debt | -11,782 | |||||||||
| Equity Value | 75,718 | |||||||||
| Diluted Shares Outstanding, MM | 2,987 | |||||||||
| Equity Value Per Share | 25.35 |
What You Will Receive
- Authentic 601699SS Financials: Access to historical and projected data for precise valuation.
- Customizable Inputs: Adjust WACC, tax rates, revenue growth, and capital investment figures.
- Automatic Calculations: Intrinsic value and NPV are computed in real-time.
- Scenario Analysis: Explore various scenarios to assess the future performance of Shanxi Lu'an Environmental Energy Development Co., Ltd.
- User-Friendly Design: Designed for professionals but easy enough for newcomers to navigate.
Key Features
- Reliable Financial Data for Shanxi Lu'an: Access precise pre-loaded historical data and future forecasts.
- Tailorable Projection Parameters: Modify highlighted fields such as WACC, growth rates, and profit margins.
- Real-Time Calculations: Instant updates to DCF, Net Present Value (NPV), and cash flow metrics.
- Interactive Dashboard: User-friendly graphs and summaries to illustrate your valuation outcomes.
- Suitable for All Levels: An intuitive design catered to investors, CFOs, and consultants alike.
How It Functions
- Download: Obtain the pre-formatted Excel file containing Shanxi Lu'an Environmental Energy Development Co., Ltd.'s (601699SS) financial data.
- Customize: Tailor projections, such as revenue growth, EBITDA %, and WACC to fit your analysis.
- Update Instantly: The intrinsic value and NPV calculations refresh automatically in real-time.
- Experiment with Scenarios: Generate various forecasts and instantly compare the results.
- Make Informed Choices: Leverage the valuation insights to shape your investment decisions.
Why Choose This Calculator for Shanxi Lu'an Environmental Energy Development Co., Ltd. (601699SS)?
- User-Friendly Interface: Tailored for both novice and experienced users.
- Customizable Inputs: Easily adjust parameters to suit your analysis needs.
- Real-Time Valuation: Instantly observe how changes affect the valuation of Shanxi Lu'an (601699SS).
- Preconfigured Data: Comes with Shanxi Lu'an's latest financial figures for immediate use.
- Relied Upon by Experts: Utilized by investors and analysts to make well-informed choices.
Who Should Benefit from This Product?
- Individual Investors: Make informed choices regarding the purchase or sale of Shanxi Lu'an Environmental Energy Development Co., Ltd. (601699SS) shares.
- Financial Analysts: Enhance valuation efforts with accessible financial models tailored for the industry.
- Consultants: Provide clients with accurate and timely valuation analysis for Shanxi Lu'an (601699SS).
- Business Owners: Gain insights into the valuation of large firms like Shanxi Lu'an to inform your own business strategies.
- Finance Students: Develop valuation skills using real-world data and specific case studies from Shanxi Lu'an (601699SS).
Contents of the Template
- Pre-Filled Data: Contains Shanxi Lu'an's historical financial performance and forecasts.
- Discounted Cash Flow Model: An editable DCF valuation model featuring automatic calculations.
- Weighted Average Cost of Capital (WACC): A specific sheet for calculating WACC using customized inputs.
- Key Financial Ratios: Evaluate Shanxi Lu'an’s profitability, efficiency, and debt management.
- Customizable Inputs: Easily modify revenue growth projections, profit margins, and tax rates.
- Clear Dashboard: Visual representations including charts and tables summarizing essential valuation outcomes.
Disclaimer
All information, articles, and product details provided on this website are for general informational and educational purposes only. We do not claim any ownership over, nor do we intend to infringe upon, any trademarks, copyrights, logos, brand names, or other intellectual property mentioned or depicted on this site. Such intellectual property remains the property of its respective owners, and any references here are made solely for identification or informational purposes, without implying any affiliation, endorsement, or partnership.
We make no representations or warranties, express or implied, regarding the accuracy, completeness, or suitability of any content or products presented. Nothing on this website should be construed as legal, tax, investment, financial, medical, or other professional advice. In addition, no part of this site—including articles or product references—constitutes a solicitation, recommendation, endorsement, advertisement, or offer to buy or sell any securities, franchises, or other financial instruments, particularly in jurisdictions where such activity would be unlawful.
All content is of a general nature and may not address the specific circumstances of any individual or entity. It is not a substitute for professional advice or services. Any actions you take based on the information provided here are strictly at your own risk. You accept full responsibility for any decisions or outcomes arising from your use of this website and agree to release us from any liability in connection with your use of, or reliance upon, the content or products found herein.