
|
Beijing Jingyuntong Technology Co., Ltd. (601908.ss) Valoración de DCF |
Completamente Editable: Adáptelo A Sus Necesidades En Excel O Sheets
Diseño Profesional: Plantillas Confiables Y Estándares De La Industria
Predeterminadas Para Un Uso Rápido Y Eficiente
Compatible con MAC / PC, completamente desbloqueado
No Se Necesita Experiencia; Fáciles De Seguir
Beijing Jingyuntong Technology Co., Ltd. (601908.SS) Bundle
Ya sea que sea un inversor o analista, esta calculadora DCF (601908SS) es su recurso ideal para una valoración precisa. Precedidos con datos de Beijing Jingyuntong Technology Co., Ltd., puede ajustar los pronósticos y observar los efectos en tiempo real.
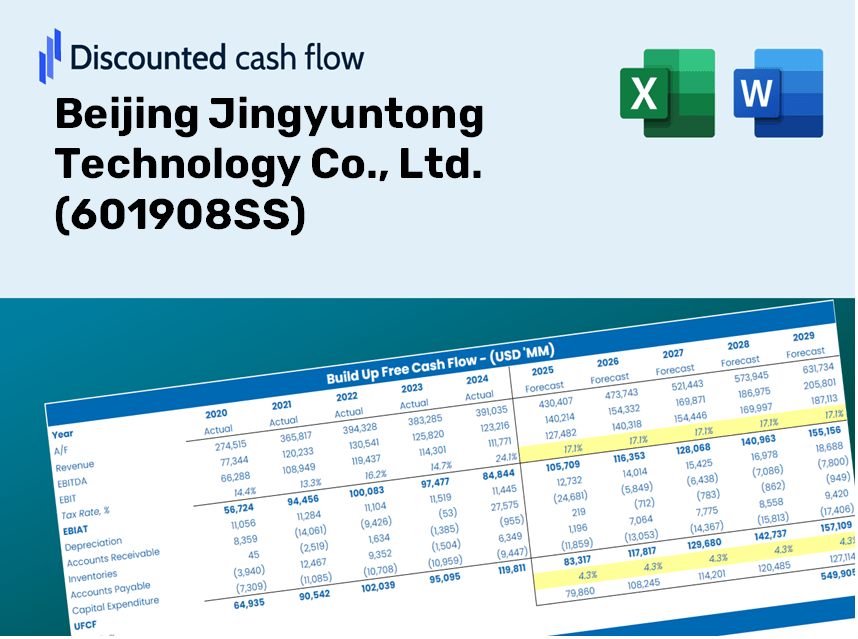
Discounted Cash Flow (DCF) - (USD MM)
| Year | AY1 2020 |
AY2 2021 |
AY3 2022 |
AY4 2023 |
AY5 2024 |
FY1 2025 |
FY2 2026 |
FY3 2027 |
FY4 2028 |
FY5 2029 |
|---|---|---|---|---|---|---|---|---|---|---|
| Revenue | 4,056.2 | 5,525.6 | 12,199.2 | 10,501.5 | 4,590.8 | 5,348.5 | 6,231.4 | 7,259.9 | 8,458.3 | 9,854.4 |
| Revenue Growth, % | 0 | 36.23 | 120.78 | -13.92 | -56.28 | 16.51 | 16.51 | 16.51 | 16.51 | 16.51 |
| EBITDA | 1,552.7 | 2,007.7 | 1,671.1 | 1,239.6 | -707.4 | 906.1 | 1,055.7 | 1,230.0 | 1,433.0 | 1,669.5 |
| EBITDA, % | 38.28 | 36.34 | 13.7 | 11.8 | -15.41 | 16.94 | 16.94 | 16.94 | 16.94 | 16.94 |
| Depreciation | 595.3 | 613.6 | 696.6 | 750.1 | 867.3 | 615.4 | 717.0 | 835.3 | 973.2 | 1,133.8 |
| Depreciation, % | 14.68 | 11.1 | 5.71 | 7.14 | 18.89 | 11.51 | 11.51 | 11.51 | 11.51 | 11.51 |
| EBIT | 957.4 | 1,394.1 | 974.6 | 489.5 | -1,574.7 | 290.8 | 338.7 | 394.7 | 459.8 | 535.7 |
| EBIT, % | 23.6 | 25.23 | 7.99 | 4.66 | -34.3 | 5.44 | 5.44 | 5.44 | 5.44 | 5.44 |
| Total Cash | 806.6 | 4,775.2 | 3,405.4 | 3,212.6 | 526.6 | 1,885.7 | 2,197.0 | 2,559.6 | 2,982.1 | 3,474.4 |
| Total Cash, percent | .0 | .0 | .0 | .0 | .0 | .0 | .0 | .0 | .0 | .0 |
| Account Receivables | 2,577.5 | 3,095.9 | 4,063.0 | 3,830.8 | 4,113.9 | 2,984.2 | 3,476.8 | 4,050.6 | 4,719.2 | 5,498.2 |
| Account Receivables, % | 63.55 | 56.03 | 33.31 | 36.48 | 89.61 | 55.79 | 55.79 | 55.79 | 55.79 | 55.79 |
| Inventories | 593.4 | 1,622.7 | 1,678.4 | 2,018.7 | 890.4 | 1,030.9 | 1,201.1 | 1,399.4 | 1,630.3 | 1,899.5 |
| Inventories, % | 14.63 | 29.37 | 13.76 | 19.22 | 19.4 | 19.28 | 19.28 | 19.28 | 19.28 | 19.28 |
| Accounts Payable | 1,282.9 | 2,485.8 | 2,376.4 | 3,364.3 | 2,903.5 | 2,047.2 | 2,385.1 | 2,778.8 | 3,237.4 | 3,771.8 |
| Accounts Payable, % | 31.63 | 44.99 | 19.48 | 32.04 | 63.25 | 38.28 | 38.28 | 38.28 | 38.28 | 38.28 |
| Capital Expenditure | -438.9 | -900.2 | -311.3 | -1,059.5 | -348.6 | -506.5 | -590.1 | -687.5 | -800.9 | -933.1 |
| Capital Expenditure, % | -10.82 | -16.29 | -2.55 | -10.09 | -7.59 | -9.47 | -9.47 | -9.47 | -9.47 | -9.47 |
| Tax Rate, % | 2.95 | 2.95 | 2.95 | 2.95 | 2.95 | 2.95 | 2.95 | 2.95 | 2.95 | 2.95 |
| EBITAT | 843.6 | 1,084.0 | 787.9 | 1,647.7 | -1,528.3 | 258.1 | 300.7 | 350.3 | 408.1 | 475.5 |
| Depreciation | ||||||||||
| Changes in Account Receivables | ||||||||||
| Changes in Inventories | ||||||||||
| Changes in Accounts Payable | ||||||||||
| Capital Expenditure | ||||||||||
| UFCF | -888.0 | 452.7 | 41.1 | 2,218.0 | -625.1 | 499.9 | 102.7 | 119.7 | 139.4 | 162.4 |
| WACC, % | 9.44 | 9.12 | 9.21 | 9.81 | 9.72 | 9.46 | 9.46 | 9.46 | 9.46 | 9.46 |
| PV UFCF | ||||||||||
| SUM PV UFCF | 834.2 | |||||||||
| Long Term Growth Rate, % | 2.00 | |||||||||
| Free cash flow (T + 1) | 166 | |||||||||
| Terminal Value | 2,221 | |||||||||
| Present Terminal Value | 1,414 | |||||||||
| Enterprise Value | 2,248 | |||||||||
| Net Debt | 1,674 | |||||||||
| Equity Value | 574 | |||||||||
| Diluted Shares Outstanding, MM | 2,409 | |||||||||
| Equity Value Per Share | 0.24 |
Benefits You Will Receive
- Genuine (601908SS) Financial Data: Pre-loaded with comprehensive historical and projected data for accurate analysis.
- Customizable Template: Easily adjust essential inputs such as revenue growth, WACC, and EBITDA margin.
- Instant Calculations: Watch as the intrinsic value of (601908SS) refreshes automatically with each adjustment.
- Expert Valuation Tool: Tailored for investors, analysts, and consultants aiming for precise DCF outcomes.
- Intuitive Interface: Streamlined layout and straightforward instructions suitable for all user levels.
Key Features
- Accurate Financial Data for Beijing Jingyuntong Technology: Obtain reliable pre-loaded historical performance and projections for the future.
- Tailorable Forecast Parameters: Modify the yellow-highlighted cells such as WACC, growth rates, and profit margins.
- Real-Time Calculations: Automatic adjustments to DCF, Net Present Value (NPV), and cash flow analytics.
- Interactive Dashboard: Clear and concise charts and summaries that help you visualize your valuation outcomes.
- Designed for All Users: An intuitive and straightforward layout suitable for investors, CFOs, and consultants alike.
How It Works
- Step 1: Download the Excel file.
- Step 2: Review the pre-filled data for Beijing Jingyuntong Technology Co., Ltd. (601908SS) including historical and projected figures.
- Step 3: Modify the key assumptions (highlighted in yellow) according to your analysis.
- Step 4: Observe the automatic recalculations for the intrinsic value of Beijing Jingyuntong Technology Co., Ltd. (601908SS).
- Step 5: Utilize the results for making investment decisions or for reporting purposes.
Why Choose This Calculator for Beijing Jingyuntong Technology Co., Ltd. (601908SS)?
- Precision: Leverages authentic financial data from Beijing Jingyuntong for enhanced accuracy.
- Versatility: Allows users to easily test and adjust parameters to suit their needs.
- Efficiency: Avoid the complexities of constructing a DCF model from the ground up.
- High Standards: Crafted with the diligence and functionality expected at the CFO level.
- Intuitive Design: Simple to navigate, even for those new to financial modeling.
Who Should Use This Product?
- Individual Investors: Make informed choices when trading shares of Beijing Jingyuntong Technology Co., Ltd. (601908SS).
- Financial Analysts: Enhance your valuation analysis with accessible financial models specifically designed for (601908SS).
- Consultants: Provide clients with rapid and accurate valuation insights regarding (601908SS).
- Business Owners: Gain a deeper understanding of how major firms like Beijing Jingyuntong Technology Co., Ltd. (601908SS) are valued to refine your business strategies.
- Finance Students: Acquire practical valuation skills using real-world data and case studies related to (601908SS).
Contents of the Template
- Historical Data: Features Beijing Jingyuntong Technology Co., Ltd. (601908SS)'s previous financial performance and foundational forecasts.
- DCF and Levered DCF Models: Comprehensive templates designed to assess the intrinsic value of Beijing Jingyuntong Technology Co., Ltd. (601908SS).
- WACC Sheet: Pre-structured calculations for the Weighted Average Cost of Capital.
- Editable Inputs: Customize essential drivers such as growth rates, EBITDA percentages, and CAPEX assumptions.
- Quarterly and Annual Statements: A thorough analysis of Beijing Jingyuntong Technology Co., Ltd. (601908SS)'s financial statements.
- Interactive Dashboard: Dynamically visualize valuation outcomes and projections.
Disclaimer
All information, articles, and product details provided on this website are for general informational and educational purposes only. We do not claim any ownership over, nor do we intend to infringe upon, any trademarks, copyrights, logos, brand names, or other intellectual property mentioned or depicted on this site. Such intellectual property remains the property of its respective owners, and any references here are made solely for identification or informational purposes, without implying any affiliation, endorsement, or partnership.
We make no representations or warranties, express or implied, regarding the accuracy, completeness, or suitability of any content or products presented. Nothing on this website should be construed as legal, tax, investment, financial, medical, or other professional advice. In addition, no part of this site—including articles or product references—constitutes a solicitation, recommendation, endorsement, advertisement, or offer to buy or sell any securities, franchises, or other financial instruments, particularly in jurisdictions where such activity would be unlawful.
All content is of a general nature and may not address the specific circumstances of any individual or entity. It is not a substitute for professional advice or services. Any actions you take based on the information provided here are strictly at your own risk. You accept full responsibility for any decisions or outcomes arising from your use of this website and agree to release us from any liability in connection with your use of, or reliance upon, the content or products found herein.