
|
Shandong Linglong Tire Co., Ltd. (601966.ss) Valoración de DCF |
Completamente Editable: Adáptelo A Sus Necesidades En Excel O Sheets
Diseño Profesional: Plantillas Confiables Y Estándares De La Industria
Predeterminadas Para Un Uso Rápido Y Eficiente
Compatible con MAC / PC, completamente desbloqueado
No Se Necesita Experiencia; Fáciles De Seguir
Shandong Linglong Tyre Co.,Ltd. (601966.SS) Bundle
¡Explore el potencial financiero de Shandong Linglong Tire Co., Ltd. (601966SS) con nuestra calculadora DCF fácil de usar! Ingrese sus suposiciones para el crecimiento, los márgenes y los gastos para calcular el valor intrínseco de Shandong Linglong Tire Co., Ltd. (601966SS) y mejorar su estrategia de inversión.
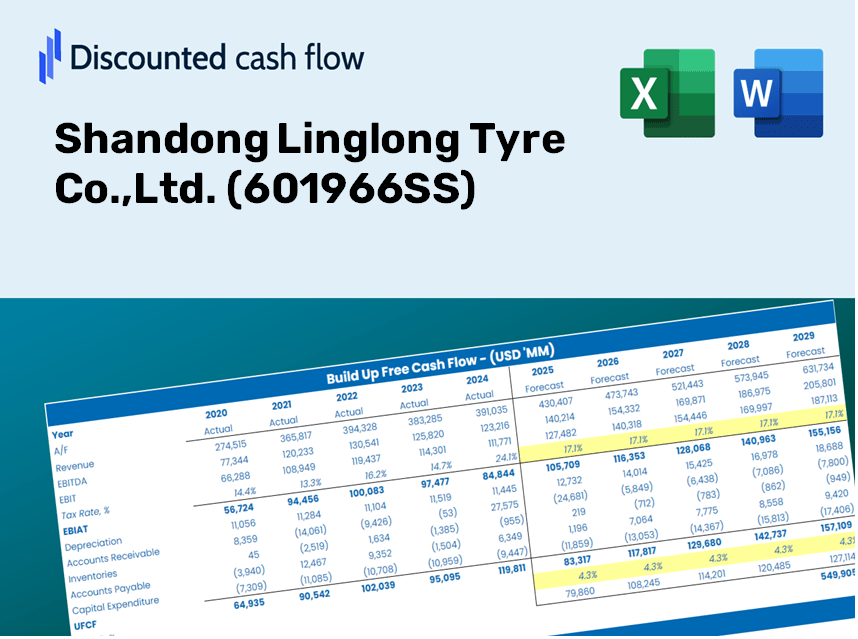
Discounted Cash Flow (DCF) - (USD MM)
| Year | AY1 2020 |
AY2 2021 |
AY3 2022 |
AY4 2023 |
AY5 2024 |
FY1 2025 |
FY2 2026 |
FY3 2027 |
FY4 2028 |
FY5 2029 |
|---|---|---|---|---|---|---|---|---|---|---|
| Revenue | 18,382.7 | 18,579.2 | 17,005.9 | 20,165.3 | 22,057.9 | 23,192.0 | 24,384.3 | 25,637.9 | 26,956.0 | 28,341.9 |
| Revenue Growth, % | 0 | 1.07 | -8.47 | 18.58 | 9.39 | 5.14 | 5.14 | 5.14 | 5.14 | 5.14 |
| EBITDA | 3,751.8 | 1,882.4 | 1,356.7 | 2,857.1 | 3,807.3 | 3,244.5 | 3,411.3 | 3,586.7 | 3,771.1 | 3,964.9 |
| EBITDA, % | 20.41 | 10.13 | 7.98 | 14.17 | 17.26 | 13.99 | 13.99 | 13.99 | 13.99 | 13.99 |
| Depreciation | 1,158.2 | 1,187.9 | 1,250.2 | 1,353.5 | 1,569.2 | 1,571.1 | 1,651.9 | 1,736.8 | 1,826.1 | 1,920.0 |
| Depreciation, % | 6.3 | 6.39 | 7.35 | 6.71 | 7.11 | 6.77 | 6.77 | 6.77 | 6.77 | 6.77 |
| EBIT | 2,593.6 | 694.5 | 106.6 | 1,503.7 | 2,238.2 | 1,673.4 | 1,759.4 | 1,849.9 | 1,945.0 | 2,045.0 |
| EBIT, % | 14.11 | 3.74 | 0.62669 | 7.46 | 10.15 | 7.22 | 7.22 | 7.22 | 7.22 | 7.22 |
| Total Cash | 4,316.0 | 2,338.1 | 2,969.6 | 4,006.9 | 4,459.9 | 4,342.2 | 4,565.5 | 4,800.2 | 5,047.0 | 5,306.4 |
| Total Cash, percent | .0 | .0 | .0 | .0 | .0 | .0 | .0 | .0 | .0 | .0 |
| Account Receivables | 4,084.5 | 3,500.4 | 3,466.3 | 4,708.9 | 5,001.8 | 4,984.9 | 5,241.2 | 5,510.6 | 5,793.9 | 6,091.8 |
| Account Receivables, % | 22.22 | 18.84 | 20.38 | 23.35 | 22.68 | 21.49 | 21.49 | 21.49 | 21.49 | 21.49 |
| Inventories | 2,874.6 | 4,534.5 | 4,472.5 | 4,743.8 | 5,789.1 | 5,385.8 | 5,662.7 | 5,953.8 | 6,259.9 | 6,581.7 |
| Inventories, % | 15.64 | 24.41 | 26.3 | 23.52 | 26.25 | 23.22 | 23.22 | 23.22 | 23.22 | 23.22 |
| Accounts Payable | 2,471.3 | 2,679.0 | 2,640.6 | 3,385.3 | 5,415.1 | 3,930.0 | 4,132.0 | 4,344.5 | 4,567.8 | 4,802.7 |
| Accounts Payable, % | 13.44 | 14.42 | 15.53 | 16.79 | 24.55 | 16.95 | 16.95 | 16.95 | 16.95 | 16.95 |
| Capital Expenditure | -2,449.3 | -4,888.9 | -3,522.0 | -3,124.1 | -2,442.5 | -4,031.4 | -4,238.6 | -4,456.6 | -4,685.7 | -4,926.6 |
| Capital Expenditure, % | -13.32 | -26.31 | -20.71 | -15.49 | -11.07 | -17.38 | -17.38 | -17.38 | -17.38 | -17.38 |
| Tax Rate, % | 11.08 | 11.08 | 11.08 | 11.08 | 11.08 | 11.08 | 11.08 | 11.08 | 11.08 | 11.08 |
| EBITAT | 2,492.2 | 767.3 | 198.4 | 1,367.4 | 1,990.3 | 1,592.9 | 1,674.8 | 1,760.9 | 1,851.4 | 1,946.6 |
| Depreciation | ||||||||||
| Changes in Account Receivables | ||||||||||
| Changes in Inventories | ||||||||||
| Changes in Accounts Payable | ||||||||||
| Capital Expenditure | ||||||||||
| UFCF | -3,286.7 | -3,801.8 | -2,015.7 | -1,172.4 | 1,808.5 | -1,932.2 | -1,243.1 | -1,307.0 | -1,374.2 | -1,444.9 |
| WACC, % | 6.05 | 6.11 | 6.11 | 5.98 | 5.95 | 6.04 | 6.04 | 6.04 | 6.04 | 6.04 |
| PV UFCF | ||||||||||
| SUM PV UFCF | -6,188.4 | |||||||||
| Long Term Growth Rate, % | 2.00 | |||||||||
| Free cash flow (T + 1) | -1,474 | |||||||||
| Terminal Value | -36,483 | |||||||||
| Present Terminal Value | -27,212 | |||||||||
| Enterprise Value | -33,400 | |||||||||
| Net Debt | 9,956 | |||||||||
| Equity Value | -43,356 | |||||||||
| Diluted Shares Outstanding, MM | 1,460 | |||||||||
| Equity Value Per Share | -29.69 |
Benefits You'll Receive
- Comprehensive Financial Model: Shandong Linglong's actual data facilitates accurate DCF valuation.
- Complete Forecast Flexibility: Modify revenue growth, profit margins, WACC, and other essential factors.
- Real-Time Calculations: Instant updates ensure you see results as adjustments are made.
- Professional-Grade Template: A polished Excel document crafted for expert valuation.
- Customizable and Reusable: Designed with flexibility for repeated use in detailed forecasts.
Key Features
- Real-Time 601966SS Data: Pre-loaded with Shandong Linglong Tyre's historical financial information and future outlooks.
- Completely Customizable Variables: Modify growth rates, profit margins, discount rates, taxation, and capital investments.
- Adaptive Valuation Framework: Automatically refreshes Net Present Value (NPV) and intrinsic value based on your adjustments.
- Scenario Analysis: Design various forecasting scenarios to evaluate different valuation results.
- Intuitive User Experience: Streamlined and organized for both seasoned professionals and novices.
How It Works
- Step 1: Download the Excel file.
- Step 2: Review the pre-populated data for Shandong Linglong Tyre Co., Ltd. (601966SS), including historical and projected figures.
- Step 3: Modify key assumptions (highlighted in yellow) based on your analysis.
- Step 4: Observe automatic recalculations to determine Shandong Linglong Tyre's intrinsic value.
- Step 5: Utilize the results for investment decisions or reporting purposes.
Why Choose Shandong Linglong Tyre Co., Ltd. (601966SS)?
- Precision: Reliable financial data guarantees high accuracy.
- Versatility: Tailored for users to easily modify and experiment with inputs.
- Efficiency: Eliminate the need to create a financial model from scratch.
- Expert-Level: Crafted with the expertise and precision expected at the CFO level.
- User-Friendly: Intuitive interface accessible for users of all experience levels.
Who Should Consider This Product?
- Investors: Evaluate Shandong Linglong Tyre Co., Ltd.'s (601966SS) market position prior to making investment decisions.
- CFOs and Financial Analysts: Optimize valuation processes and validate financial forecasts.
- Startup Founders: Gain insights into the valuation methods of leading companies like Shandong Linglong Tyre Co., Ltd. (601966SS).
- Consultants: Create comprehensive valuation reports tailored for your clients.
- Students and Educators: Utilize authentic data to enhance the understanding and teaching of valuation practices.
Contents of the Template
- Pre-Filled Data: Contains Shandong Linglong Tyre Co., Ltd.’s historical financial information and projections.
- Discounted Cash Flow Model: An editable DCF valuation model featuring automatic calculations.
- Weighted Average Cost of Capital (WACC): A dedicated section for WACC calculations based on user-defined inputs.
- Key Financial Ratios: Assess Shandong Linglong's profitability, efficiency, and leverage.
- Customizable Inputs: Easily modify revenue growth rates, margins, and tax percentages.
- Comprehensive Dashboard: Visual representations and tables summarizing essential valuation outcomes.
Disclaimer
All information, articles, and product details provided on this website are for general informational and educational purposes only. We do not claim any ownership over, nor do we intend to infringe upon, any trademarks, copyrights, logos, brand names, or other intellectual property mentioned or depicted on this site. Such intellectual property remains the property of its respective owners, and any references here are made solely for identification or informational purposes, without implying any affiliation, endorsement, or partnership.
We make no representations or warranties, express or implied, regarding the accuracy, completeness, or suitability of any content or products presented. Nothing on this website should be construed as legal, tax, investment, financial, medical, or other professional advice. In addition, no part of this site—including articles or product references—constitutes a solicitation, recommendation, endorsement, advertisement, or offer to buy or sell any securities, franchises, or other financial instruments, particularly in jurisdictions where such activity would be unlawful.
All content is of a general nature and may not address the specific circumstances of any individual or entity. It is not a substitute for professional advice or services. Any actions you take based on the information provided here are strictly at your own risk. You accept full responsibility for any decisions or outcomes arising from your use of this website and agree to release us from any liability in connection with your use of, or reliance upon, the content or products found herein.