
|
China Shipbuilding Industry Company Limited (601989.ss) Valoración de DCF |
Completamente Editable: Adáptelo A Sus Necesidades En Excel O Sheets
Diseño Profesional: Plantillas Confiables Y Estándares De La Industria
Predeterminadas Para Un Uso Rápido Y Eficiente
Compatible con MAC / PC, completamente desbloqueado
No Se Necesita Experiencia; Fáciles De Seguir
China Shipbuilding Industry Company Limited (601989.SS) Bundle
¡Streamline China Shipbuilding Industry Company Limited (601989SS) Valoración con nuestra calculadora DCF flexible! Con auténticas finanzas de la compañía de construcción naval de la creación de construcciones de China (601989SS) y variables de pronóstico modificables, puede explorar diferentes escenarios y determinar el valor razonable de China Shipbuilding Industry Company Limited (601989SS) en solo minutos.
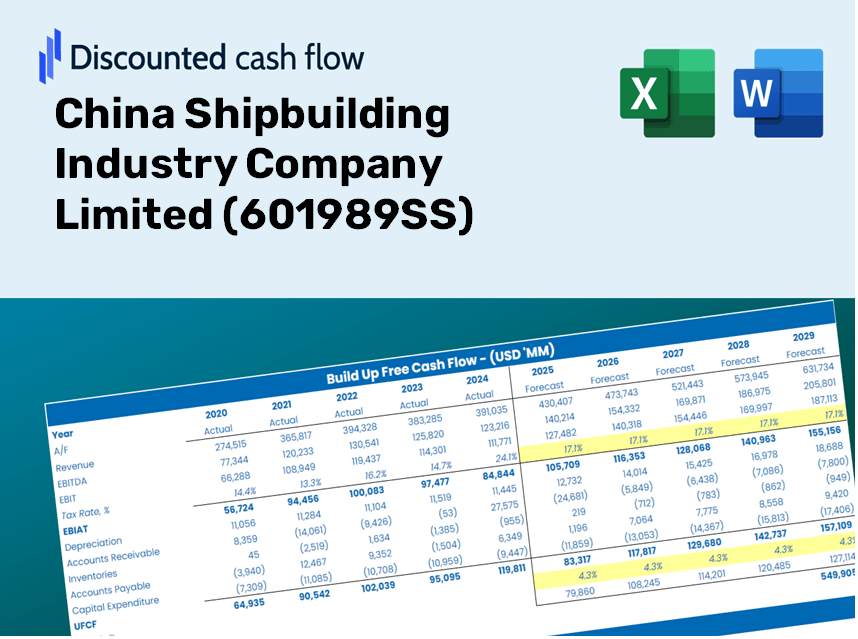
Discounted Cash Flow (DCF) - (USD MM)
| Year | AY1 2020 |
AY2 2021 |
AY3 2022 |
AY4 2023 |
AY5 2024 |
FY1 2025 |
FY2 2026 |
FY3 2027 |
FY4 2028 |
FY5 2029 |
|---|---|---|---|---|---|---|---|---|---|---|
| Revenue | 34,906.2 | 39,539.4 | 44,154.9 | 46,693.8 | 55,436.3 | 62,285.4 | 69,980.7 | 78,626.7 | 88,340.9 | 99,255.3 |
| Revenue Growth, % | 0 | 13.27 | 11.67 | 5.75 | 18.72 | 12.35 | 12.35 | 12.35 | 12.35 | 12.35 |
| EBITDA | 2,024.3 | 2,638.0 | 178.1 | 1,734.7 | 4,011.4 | 2,968.0 | 3,334.7 | 3,746.7 | 4,209.6 | 4,729.7 |
| EBITDA, % | 5.8 | 6.67 | 0.40341 | 3.72 | 7.24 | 4.77 | 4.77 | 4.77 | 4.77 | 4.77 |
| Depreciation | 1,889.8 | 2,050.8 | 2,077.7 | 2,019.6 | 2,075.6 | 2,911.9 | 3,271.6 | 3,675.8 | 4,130.0 | 4,640.2 |
| Depreciation, % | 5.41 | 5.19 | 4.71 | 4.33 | 3.74 | 4.68 | 4.68 | 4.68 | 4.68 | 4.68 |
| EBIT | 134.5 | 587.2 | -1,899.6 | -284.8 | 1,935.9 | 56.1 | 63.1 | 70.8 | 79.6 | 89.4 |
| EBIT, % | 0.38527 | 1.49 | -4.3 | -0.61002 | 3.49 | 0.09009796 | 0.09009796 | 0.09009796 | 0.09009796 | 0.09009796 |
| Total Cash | 62,422.3 | 67,978.7 | 74,922.5 | 76,264.6 | 85,522.7 | 62,285.4 | 69,980.7 | 78,626.7 | 88,340.9 | 99,255.3 |
| Total Cash, percent | .0 | .0 | .0 | .0 | .0 | .0 | .0 | .0 | .0 | .0 |
| Account Receivables | 11,110.4 | 12,550.5 | 14,857.0 | 17,597.4 | 17,507.3 | 20,739.3 | 23,301.6 | 26,180.5 | 29,415.1 | 33,049.3 |
| Account Receivables, % | 31.83 | 31.74 | 33.65 | 37.69 | 31.58 | 33.3 | 33.3 | 33.3 | 33.3 | 33.3 |
| Inventories | 26,722.4 | 26,606.1 | 25,405.1 | 28,671.5 | 30,506.9 | 39,590.5 | 44,481.8 | 49,977.5 | 56,152.1 | 63,089.7 |
| Inventories, % | 76.55 | 67.29 | 57.54 | 61.4 | 55.03 | 63.56 | 63.56 | 63.56 | 63.56 | 63.56 |
| Accounts Payable | 27,349.8 | 30,811.2 | 24,314.7 | 21,861.1 | 31,886.3 | 39,324.7 | 44,183.2 | 49,642.0 | 55,775.2 | 62,666.1 |
| Accounts Payable, % | 78.35 | 77.93 | 55.07 | 46.82 | 57.52 | 63.14 | 63.14 | 63.14 | 63.14 | 63.14 |
| Capital Expenditure | -2,172.5 | -1,173.8 | -1,279.1 | -1,433.5 | -5,336.6 | -3,087.6 | -3,469.1 | -3,897.7 | -4,379.2 | -4,920.2 |
| Capital Expenditure, % | -6.22 | -2.97 | -2.9 | -3.07 | -9.63 | -4.96 | -4.96 | -4.96 | -4.96 | -4.96 |
| Tax Rate, % | 5.42 | 5.42 | 5.42 | 5.42 | 5.42 | 5.42 | 5.42 | 5.42 | 5.42 | 5.42 |
| EBITAT | 173.9 | 436.1 | -1,812.0 | -293.4 | 1,830.9 | 52.1 | 58.5 | 65.8 | 73.9 | 83.0 |
| Depreciation | ||||||||||
| Changes in Account Receivables | ||||||||||
| Changes in Inventories | ||||||||||
| Changes in Accounts Payable | ||||||||||
| Capital Expenditure | ||||||||||
| UFCF | -10,591.7 | 3,450.8 | -8,615.5 | -8,167.7 | 6,849.6 | -5,000.8 | -2,734.0 | -3,071.8 | -3,451.3 | -3,877.7 |
| WACC, % | 5.66 | 5.52 | 5.63 | 5.66 | 5.63 | 5.62 | 5.62 | 5.62 | 5.62 | 5.62 |
| PV UFCF | ||||||||||
| SUM PV UFCF | -15,516.2 | |||||||||
| Long Term Growth Rate, % | 4.00 | |||||||||
| Free cash flow (T + 1) | -4,033 | |||||||||
| Terminal Value | -248,969 | |||||||||
| Present Terminal Value | -189,417 | |||||||||
| Enterprise Value | -204,933 | |||||||||
| Net Debt | -67,070 | |||||||||
| Equity Value | -137,863 | |||||||||
| Diluted Shares Outstanding, MM | 22,994 | |||||||||
| Equity Value Per Share | -6.00 |
What You Will Receive
- Flexible Forecast Inputs: Easily adjust key assumptions (growth %, margins, WACC) to explore various scenarios.
- Comprehensive Data: China Shipbuilding Industry Company Limited’s (601989SS) financial information pre-filled to enhance your analysis.
- Instant DCF Calculations: The template automatically computes Net Present Value (NPV) and intrinsic value for you.
- Customizable and Professional Design: A refined Excel model tailored to meet your valuation requirements.
- Designed for Analysts and Investors: Perfect for evaluating forecasts, confirming strategies, and boosting efficiency.
Key Features
- Pre-Loaded Data: Historical financial statements and forecasts for China Shipbuilding Industry Company Limited (601989SS).
- Fully Adjustable Inputs: Modify WACC, tax rates, revenue growth, and EBITDA margins as needed.
- Instant Results: View the intrinsic value of China Shipbuilding Industry Company Limited (601989SS) recalculated in real time.
- Clear Visual Outputs: Dashboard charts present valuation results and essential metrics clearly.
- Built for Accuracy: A reliable tool designed for analysts, investors, and finance professionals.
How It Works
- Step 1: Download the Excel file.
- Step 2: Examine the pre-filled financial data and projections for China Shipbuilding Industry Company Limited (601989SS).
- Step 3: Adjust key inputs such as revenue growth, WACC, and tax rates (highlighted cells).
- Step 4: Observe the DCF model refresh in real-time as you modify your assumptions.
- Step 5: Evaluate the results and leverage the findings for your investment strategies.
Why Choose This Calculator for China Shipbuilding Industry Company Limited (601989SS)?
- Accurate Data: Utilize authentic financial data for precise valuation outcomes.
- Customizable: Modify essential parameters such as growth rates, WACC, and tax rates to align with your forecasts.
- Time-Saving: Pre-configured calculations allow you to avoid starting from scratch.
- Professional-Grade Tool: Tailored for investors, analysts, and consultants in the maritime industry.
- User-Friendly: A straightforward design and clear, step-by-step guidance make it accessible for all users.
Who Can Benefit from This Product?
- Investors: Evaluate the valuation of China Shipbuilding Industry Company Limited (601989SS) before making investment decisions.
- CFOs and Financial Analysts: Enhance valuation workflows and assess financial forecasts.
- Startup Founders: Discover the valuation methodologies applied to established companies like China Shipbuilding Industry Company Limited (601989SS).
- Consultants: Create detailed valuation reports to provide value to clients.
- Students and Educators: Utilize real-world examples to practice and teach valuation strategies.
Overview of Template Features
- Detailed DCF Model: Editable template featuring extensive valuation calculations.
- Real-World Data: Historical and projected financials for China Shipbuilding Industry Company Limited (601989SS) preloaded for analysis.
- Adjustable Parameters: Modify WACC, growth rates, and tax assumptions to explore various scenarios.
- Financial Statements: Comprehensive annual and quarterly breakdowns for enhanced insights.
- Key Financial Ratios: Integrated analysis for assessing profitability, efficiency, and leverage.
- Visualization Dashboard: Charts and tables providing clear and actionable results.
Disclaimer
All information, articles, and product details provided on this website are for general informational and educational purposes only. We do not claim any ownership over, nor do we intend to infringe upon, any trademarks, copyrights, logos, brand names, or other intellectual property mentioned or depicted on this site. Such intellectual property remains the property of its respective owners, and any references here are made solely for identification or informational purposes, without implying any affiliation, endorsement, or partnership.
We make no representations or warranties, express or implied, regarding the accuracy, completeness, or suitability of any content or products presented. Nothing on this website should be construed as legal, tax, investment, financial, medical, or other professional advice. In addition, no part of this site—including articles or product references—constitutes a solicitation, recommendation, endorsement, advertisement, or offer to buy or sell any securities, franchises, or other financial instruments, particularly in jurisdictions where such activity would be unlawful.
All content is of a general nature and may not address the specific circumstances of any individual or entity. It is not a substitute for professional advice or services. Any actions you take based on the information provided here are strictly at your own risk. You accept full responsibility for any decisions or outcomes arising from your use of this website and agree to release us from any liability in connection with your use of, or reliance upon, the content or products found herein.