
|
Nanjing Securities Co., Ltd. (601990.SS) Valoración de DCF |
Completamente Editable: Adáptelo A Sus Necesidades En Excel O Sheets
Diseño Profesional: Plantillas Confiables Y Estándares De La Industria
Predeterminadas Para Un Uso Rápido Y Eficiente
Compatible con MAC / PC, completamente desbloqueado
No Se Necesita Experiencia; Fáciles De Seguir
Nanjing Securities Co., Ltd. (601990.SS) Bundle
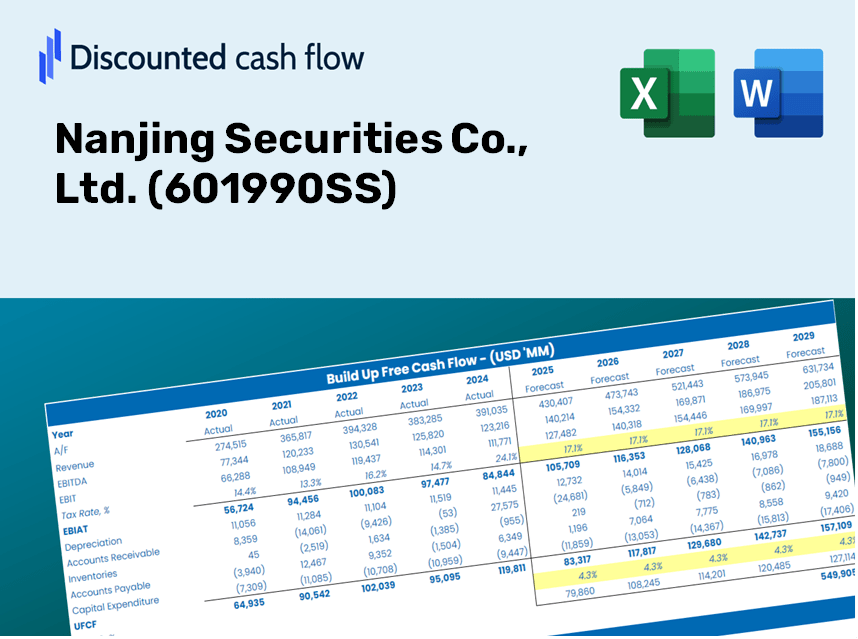
¡Simplifique la valoración de Nanjing Securities Co., Ltd. (601990SS) con esta calculadora DCF personalizable! Con Real Nanjing Securities Co., Ltd. (601990SS) financieras y entradas de pronóstico ajustables, puede probar escenarios y descubrir Nanjing Securities Co., Ltd. (601990SS) Valor razonable en minutos.
Discounted Cash Flow (DCF) - (USD MM)
| Year | AY1 2020 |
AY2 2021 |
AY3 2022 |
AY4 2023 |
AY5 2024 |
FY1 2025 |
FY2 2026 |
FY3 2027 |
FY4 2028 |
FY5 2029 |
|---|---|---|---|---|---|---|---|---|---|---|
| Revenue | 2,274.0 | 2,673.5 | 2,010.1 | 3,214.9 | 3,930.5 | 4,667.1 | 5,541.6 | 6,580.0 | 7,813.1 | 9,277.1 |
| Revenue Growth, % | 0 | 17.57 | -24.81 | 59.94 | 22.26 | 18.74 | 18.74 | 18.74 | 18.74 | 18.74 |
| EBITDA | 1,649.0 | 2,032.2 | 1,577.8 | 966.9 | .0 | 2,399.8 | 2,849.5 | 3,383.4 | 4,017.4 | 4,770.2 |
| EBITDA, % | 72.52 | 76.01 | 78.49 | 30.08 | 0 | 51.42 | 51.42 | 51.42 | 51.42 | 51.42 |
| Depreciation | 97.7 | 134.9 | 131.4 | 122.8 | 131.5 | 215.1 | 255.5 | 303.3 | 360.2 | 427.6 |
| Depreciation, % | 4.3 | 5.05 | 6.54 | 3.82 | 3.35 | 4.61 | 4.61 | 4.61 | 4.61 | 4.61 |
| EBIT | 1,551.2 | 1,897.3 | 1,446.4 | 844.1 | -131.5 | 2,184.6 | 2,594.0 | 3,080.1 | 3,657.3 | 4,342.6 |
| EBIT, % | 68.22 | 70.97 | 71.95 | 26.26 | -3.35 | 46.81 | 46.81 | 46.81 | 46.81 | 46.81 |
| Total Cash | 22,677.8 | 22,641.0 | 22,837.6 | 23,413.6 | 30,353.5 | 4,667.1 | 5,541.6 | 6,580.0 | 7,813.1 | 9,277.1 |
| Total Cash, percent | .0 | .0 | .0 | .0 | .0 | .0 | .0 | .0 | .0 | .0 |
| Account Receivables | 3.5 | 3.9 | 33.2 | 16.1 | 13.3 | 26.0 | 30.9 | 36.6 | 43.5 | 51.7 |
| Account Receivables, % | 0.15271 | 0.14472 | 1.65 | 0.49933 | 0.33778 | 0.55697 | 0.55697 | 0.55697 | 0.55697 | 0.55697 |
| Inventories | 10,664.0 | 9,106.6 | 9,114.0 | .0 | .0 | 2,800.2 | 3,325.0 | 3,948.0 | 4,687.8 | 5,566.3 |
| Inventories, % | 468.96 | 340.62 | 453.41 | 0 | 0 | 60 | 60 | 60 | 60 | 60 |
| Accounts Payable | 43.9 | 31.5 | 46.6 | 96.5 | 87.0 | 99.3 | 117.9 | 140.0 | 166.3 | 197.4 |
| Accounts Payable, % | 1.93 | 1.18 | 2.32 | 3 | 2.21 | 2.13 | 2.13 | 2.13 | 2.13 | 2.13 |
| Capital Expenditure | -86.9 | -80.2 | -73.9 | -113.3 | -128.6 | -161.4 | -191.7 | -227.6 | -270.3 | -320.9 |
| Capital Expenditure, % | -3.82 | -3 | -3.68 | -3.53 | -3.27 | -3.46 | -3.46 | -3.46 | -3.46 | -3.46 |
| Tax Rate, % | 21.71 | 21.71 | 21.71 | 21.71 | 21.71 | 21.71 | 21.71 | 21.71 | 21.71 | 21.71 |
| EBITAT | 1,209.7 | 1,472.0 | 1,187.8 | 677.0 | -103.0 | 1,731.1 | 2,055.4 | 2,440.6 | 2,897.9 | 3,441.0 |
| Depreciation | ||||||||||
| Changes in Account Receivables | ||||||||||
| Changes in Inventories | ||||||||||
| Changes in Accounts Payable | ||||||||||
| Capital Expenditure | ||||||||||
| UFCF | -9,403.1 | 3,071.4 | 1,223.7 | 9,867.5 | -106.7 | -1,015.9 | 1,608.2 | 1,909.6 | 2,267.4 | 2,692.3 |
| WACC, % | 4.25 | 4.24 | 4.33 | 4.29 | 4.26 | 4.27 | 4.27 | 4.27 | 4.27 | 4.27 |
| PV UFCF | ||||||||||
| SUM PV UFCF | 6,290.7 | |||||||||
| Long Term Growth Rate, % | 2.00 | |||||||||
| Free cash flow (T + 1) | 2,746 | |||||||||
| Terminal Value | 120,732 | |||||||||
| Present Terminal Value | 97,933 | |||||||||
| Enterprise Value | 104,224 | |||||||||
| Net Debt | 6,047 | |||||||||
| Equity Value | 98,177 | |||||||||
| Diluted Shares Outstanding, MM | 3,686 | |||||||||
| Equity Value Per Share | 26.63 |
What You Can Expect
- Genuine Nanjing Securities Data: Preloaded financial metrics – from revenue to EBIT – derived from actual and projected data.
- Comprehensive Customization: Modify all key parameters (yellow cells) such as WACC, growth %, and tax rates.
- Immediate Valuation Adjustments: Automatic recalculations to assess the influence of changes on Nanjing Securities’ fair value.
- Flexible Excel Template: Designed for quick modifications, scenario analysis, and detailed forecasting.
- Time-Efficient and Precise: Avoid building models from scratch while ensuring accuracy and adaptability.
Key Features of Nanjing Securities Co., Ltd. (601990SS)
- Accurate Financial Data: Gain access to reliable pre-loaded historical figures and future forecasts.
- Adjustable Forecast Parameters: Modify highlighted fields such as WACC, growth rates, and profit margins.
- Real-Time Calculations: Enjoy automatic updates for DCF, Net Present Value (NPV), and cash flow evaluations.
- User-Friendly Dashboard: Easily interpret valuation outcomes with intuitive charts and summaries.
- Designed for All Skill Levels: A straightforward layout tailored for investors, CFOs, and consultants alike.
How It Works
- 1. Access the Template: Download and open the Excel file containing Nanjing Securities Co., Ltd. (601990SS) preloaded data.
- 2. Modify Assumptions: Adjust key parameters such as growth rates, WACC, and capital expenditures.
- 3. Analyze Results Instantly: The DCF model automatically computes intrinsic value and NPV.
- 4. Explore Scenarios: Evaluate various forecasts to understand different valuation results.
- 5. Present with Assurance: Share professional valuation insights to inform your decisions.
Why Opt for Nanjing Securities Co., Ltd. Calculator?
- User-Friendly: Tailored for both novices and seasoned professionals.
- Customizable Inputs: Easily adjust parameters to suit your assessment needs.
- Real-Time Updates: Instantly view changes to Nanjing Securities' valuation as you modify inputs.
- Preconfigured Data: Comes with Nanjing Securities' actual financial information for swift evaluations.
- Endorsed by Experts: Utilized by investors and analysts for making well-informed choices.
Who Can Benefit from Nanjing Securities Co., Ltd. (601990SS)?
- Investors: Empower your investment choices with our advanced valuation tools.
- Financial Analysts: Streamline your workflow with our customizable DCF model.
- Consultants: Effortlessly modify our templates for client reports and presentations.
- Finance Enthusiasts: Enhance your knowledge of valuation methodologies through practical examples.
- Educators and Students: Utilize our resources as a hands-on learning aid in finance courses.
Contents of the Template
- Comprehensive DCF Model: An editable template featuring in-depth valuation calculations.
- Real-World Data: Nanjing Securities Co., Ltd.'s (601990SS) historical and projected financials preloaded for your analysis.
- Customizable Parameters: Modify WACC, growth rates, and tax assumptions to evaluate different scenarios.
- Financial Statements: Complete annual and quarterly breakdowns for enhanced insights.
- Key Ratios: Integrated analysis for profitability, efficiency, and leverage metrics.
- Dashboard with Visual Outputs: Visual charts and tables for straightforward, actionable results.
Disclaimer
All information, articles, and product details provided on this website are for general informational and educational purposes only. We do not claim any ownership over, nor do we intend to infringe upon, any trademarks, copyrights, logos, brand names, or other intellectual property mentioned or depicted on this site. Such intellectual property remains the property of its respective owners, and any references here are made solely for identification or informational purposes, without implying any affiliation, endorsement, or partnership.
We make no representations or warranties, express or implied, regarding the accuracy, completeness, or suitability of any content or products presented. Nothing on this website should be construed as legal, tax, investment, financial, medical, or other professional advice. In addition, no part of this site—including articles or product references—constitutes a solicitation, recommendation, endorsement, advertisement, or offer to buy or sell any securities, franchises, or other financial instruments, particularly in jurisdictions where such activity would be unlawful.
All content is of a general nature and may not address the specific circumstances of any individual or entity. It is not a substitute for professional advice or services. Any actions you take based on the information provided here are strictly at your own risk. You accept full responsibility for any decisions or outcomes arising from your use of this website and agree to release us from any liability in connection with your use of, or reliance upon, the content or products found herein.