
|
Xilinmen Furniture Co., Ltd (603008.SS) Valoración de DCF |
Completamente Editable: Adáptelo A Sus Necesidades En Excel O Sheets
Diseño Profesional: Plantillas Confiables Y Estándares De La Industria
Predeterminadas Para Un Uso Rápido Y Eficiente
Compatible con MAC / PC, completamente desbloqueado
No Se Necesita Experiencia; Fáciles De Seguir
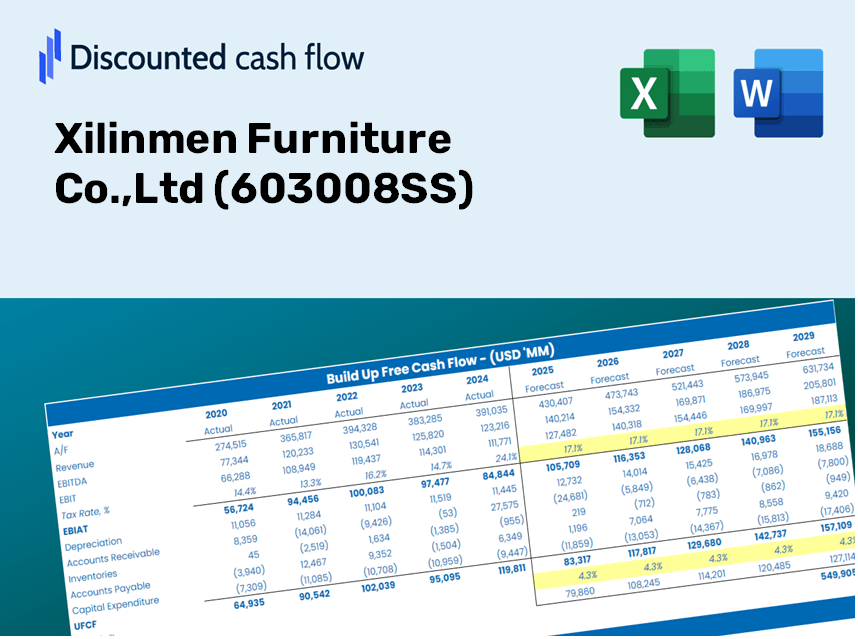
Xilinmen Furniture Co.,Ltd (603008.SS) Bundle
¡Mejore sus estrategias de inversión con la calculadora DCF (603008SS)! Revise la auténtica Xilinmen Furniture Co., Ltd Financials, ajuste las predicciones y gastos de crecimiento, y observe instantáneamente cómo estas modificaciones afectan el valor intrínseco de (603008SS).
Discounted Cash Flow (DCF) - (USD MM)
| Year | AY1 2020 |
AY2 2021 |
AY3 2022 |
AY4 2023 |
AY5 2024 |
FY1 2025 |
FY2 2026 |
FY3 2027 |
FY4 2028 |
FY5 2029 |
|---|---|---|---|---|---|---|---|---|---|---|
| Revenue | 5,623.3 | 7,771.8 | 7,838.7 | 8,678.4 | 8,729.1 | 9,828.2 | 11,065.7 | 12,459.1 | 14,027.8 | 15,794.1 |
| Revenue Growth, % | 0 | 38.21 | 0.86062 | 10.71 | 0.58516 | 12.59 | 12.59 | 12.59 | 12.59 | 12.59 |
| EBITDA | 627.6 | 1,049.7 | 765.7 | 876.7 | 691.3 | 1,031.1 | 1,160.9 | 1,307.1 | 1,471.7 | 1,657.0 |
| EBITDA, % | 11.16 | 13.51 | 9.77 | 10.1 | 7.92 | 10.49 | 10.49 | 10.49 | 10.49 | 10.49 |
| Depreciation | 185.5 | 271.2 | 347.2 | 251.0 | 258.9 | 335.6 | 377.9 | 425.5 | 479.1 | 539.4 |
| Depreciation, % | 3.3 | 3.49 | 4.43 | 2.89 | 2.97 | 3.42 | 3.42 | 3.42 | 3.42 | 3.42 |
| EBIT | 442.1 | 778.6 | 418.5 | 625.6 | 432.4 | 695.5 | 783.0 | 881.6 | 992.6 | 1,117.6 |
| EBIT, % | 7.86 | 10.02 | 5.34 | 7.21 | 4.95 | 7.08 | 7.08 | 7.08 | 7.08 | 7.08 |
| Total Cash | 1,534.4 | 1,732.5 | 2,040.0 | 1,938.9 | 2,417.3 | 2,469.6 | 2,780.5 | 3,130.6 | 3,524.8 | 3,968.6 |
| Total Cash, percent | .0 | .0 | .0 | .0 | .0 | .0 | .0 | .0 | .0 | .0 |
| Account Receivables | 1,140.5 | 1,430.8 | 944.3 | 1,199.5 | 1,239.9 | 1,548.2 | 1,743.2 | 1,962.7 | 2,209.8 | 2,488.0 |
| Account Receivables, % | 20.28 | 18.41 | 12.05 | 13.82 | 14.2 | 15.75 | 15.75 | 15.75 | 15.75 | 15.75 |
| Inventories | 798.5 | 1,101.6 | 1,199.7 | 1,035.8 | 896.7 | 1,295.1 | 1,458.2 | 1,641.8 | 1,848.5 | 2,081.3 |
| Inventories, % | 14.2 | 14.17 | 15.3 | 11.94 | 10.27 | 13.18 | 13.18 | 13.18 | 13.18 | 13.18 |
| Accounts Payable | 1,673.1 | 2,354.5 | 2,122.5 | 1,482.1 | 2,208.0 | 2,545.4 | 2,866.0 | 3,226.8 | 3,633.1 | 4,090.6 |
| Accounts Payable, % | 29.75 | 30.3 | 27.08 | 17.08 | 25.29 | 25.9 | 25.9 | 25.9 | 25.9 | 25.9 |
| Capital Expenditure | -212.4 | -492.1 | -854.5 | -572.7 | -361.4 | -624.1 | -702.7 | -791.1 | -890.7 | -1,002.9 |
| Capital Expenditure, % | -3.78 | -6.33 | -10.9 | -6.6 | -4.14 | -6.35 | -6.35 | -6.35 | -6.35 | -6.35 |
| Tax Rate, % | 9.04 | 9.04 | 9.04 | 9.04 | 9.04 | 9.04 | 9.04 | 9.04 | 9.04 | 9.04 |
| EBITAT | 324.4 | 615.1 | 308.5 | 483.1 | 393.3 | 548.4 | 617.4 | 695.2 | 782.7 | 881.3 |
| Depreciation | ||||||||||
| Changes in Account Receivables | ||||||||||
| Changes in Inventories | ||||||||||
| Changes in Accounts Payable | ||||||||||
| Capital Expenditure | ||||||||||
| UFCF | 31.5 | 482.3 | -42.5 | -570.3 | 1,115.5 | -109.4 | 255.2 | 287.3 | 323.5 | 364.2 |
| WACC, % | 11.58 | 11.64 | 11.58 | 11.62 | 11.76 | 11.64 | 11.64 | 11.64 | 11.64 | 11.64 |
| PV UFCF | ||||||||||
| SUM PV UFCF | 731.7 | |||||||||
| Long Term Growth Rate, % | 2.00 | |||||||||
| Free cash flow (T + 1) | 372 | |||||||||
| Terminal Value | 3,856 | |||||||||
| Present Terminal Value | 2,224 | |||||||||
| Enterprise Value | 2,955 | |||||||||
| Net Debt | -528 | |||||||||
| Equity Value | 3,483 | |||||||||
| Diluted Shares Outstanding, MM | 379 | |||||||||
| Equity Value Per Share | 9.19 |
Benefits You Will Receive
- Comprehensive Financial Model: Leverage Xilinmen Furniture Co., Ltd's actual data for accurate DCF valuation.
- Total Forecast Flexibility: Modify revenue growth, profit margins, WACC, and other essential variables.
- Real-Time Calculations: Automatic updates allow you to see the impact of your adjustments immediately.
- Professional-Grade Template: A polished Excel file crafted for high-quality valuation needs.
- Customizable and Reusable: Designed for adaptability, making it easy to conduct detailed forecasts multiple times.
Key Features
- Customizable Projection Inputs: Adjust essential parameters such as sales growth, profit margins, and investment outlays.
- Instant DCF Valuation: Provides quick calculations for intrinsic value, net present value (NPV), and additional metrics.
- High-Precision Results: Leverages Xilinmen's actual financial data for accurate valuation insights.
- Simplified Scenario Testing: Effortlessly analyze various assumptions and their impacts on outcomes.
- Efficiency Boost: Streamlines the valuation process, removing the necessity for intricate model construction from the ground up.
How It Operates
- Step 1: Download the Excel file.
- Step 2: Examine Xilinmen Furniture Co., Ltd’s pre-filled financial data and projections.
- Step 3: Adjust key inputs such as revenue growth, WACC, and tax rates (highlighted cells).
- Step 4: Observe the DCF model update in real-time as you modify your assumptions.
- Step 5: Review the outputs and leverage the results for your investment strategies.
Why Choose This Calculator for Xilinmen Furniture Co., Ltd (603008SS)?
- Designed for Industry Experts: A sophisticated tool utilized by furniture analysts, CFOs, and consultants.
- Current Market Data: Xilinmen's historical and projected financials preloaded for precise analysis.
- Scenario Analysis: Effortlessly simulate various forecasts and assumptions.
- Transparent Results: Automatically computes intrinsic value, NPV, and essential metrics.
- User-Friendly Interface: Step-by-step guidance ensures a smooth experience.
Who Can Benefit from This Product?
- Investors: Assess the valuation of Xilinmen Furniture Co., Ltd (603008SS) before making stock trades.
- CFOs and Financial Analysts: Enhance valuation methodologies and evaluate financial projections for Xilinmen.
- Startup Founders: Gain insights into the valuation processes of established companies like Xilinmen Furniture.
- Consultants: Provide detailed valuation analyses and reports to clients featuring Xilinmen (603008SS).
- Students and Educators: Utilize real-world examples from Xilinmen Furniture Co., Ltd (603008SS) to practice and teach valuation strategies.
Contents of the Template
- Pre-Filled Data: Features historical financials and forecasts for Xilinmen Furniture Co., Ltd (603008SS).
- Discounted Cash Flow Model: An editable DCF valuation model with automatic calculation capabilities.
- Weighted Average Cost of Capital (WACC): A specific sheet designed for WACC calculations using custom inputs.
- Key Financial Ratios: Assess Xilinmen's profitability, efficiency, and leverage metrics.
- Customizable Inputs: Easily modify revenue growth, margins, and tax rates as needed.
- Clear Dashboard: Visual representations and tables summarizing the key valuation outcomes.
Disclaimer
All information, articles, and product details provided on this website are for general informational and educational purposes only. We do not claim any ownership over, nor do we intend to infringe upon, any trademarks, copyrights, logos, brand names, or other intellectual property mentioned or depicted on this site. Such intellectual property remains the property of its respective owners, and any references here are made solely for identification or informational purposes, without implying any affiliation, endorsement, or partnership.
We make no representations or warranties, express or implied, regarding the accuracy, completeness, or suitability of any content or products presented. Nothing on this website should be construed as legal, tax, investment, financial, medical, or other professional advice. In addition, no part of this site—including articles or product references—constitutes a solicitation, recommendation, endorsement, advertisement, or offer to buy or sell any securities, franchises, or other financial instruments, particularly in jurisdictions where such activity would be unlawful.
All content is of a general nature and may not address the specific circumstances of any individual or entity. It is not a substitute for professional advice or services. Any actions you take based on the information provided here are strictly at your own risk. You accept full responsibility for any decisions or outcomes arising from your use of this website and agree to release us from any liability in connection with your use of, or reliance upon, the content or products found herein.