
|
Zhejiang Sanwei Rubber Artem Co., Ltd. (603033.ss) Valoración de DCF |
Completamente Editable: Adáptelo A Sus Necesidades En Excel O Sheets
Diseño Profesional: Plantillas Confiables Y Estándares De La Industria
Predeterminadas Para Un Uso Rápido Y Eficiente
Compatible con MAC / PC, completamente desbloqueado
No Se Necesita Experiencia; Fáciles De Seguir
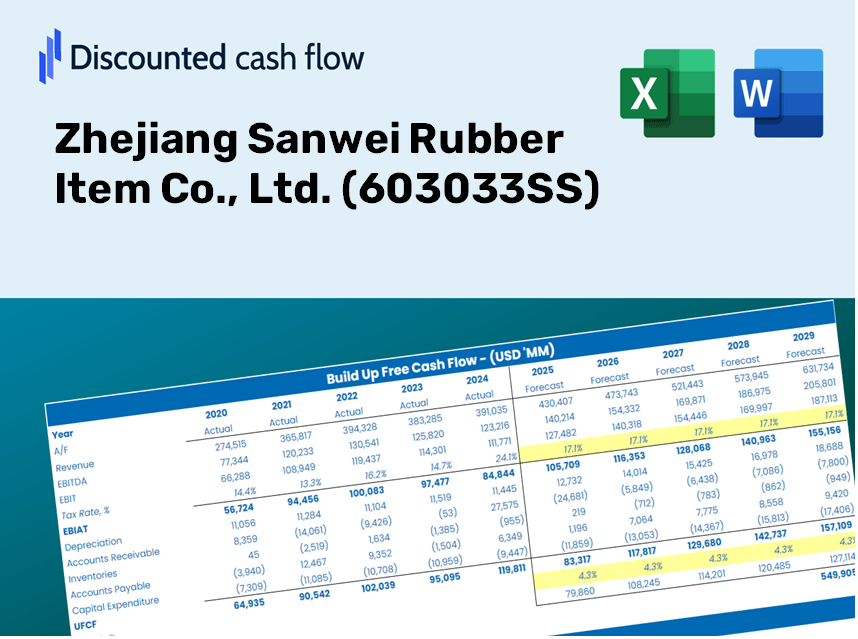
Zhejiang Sanwei Rubber Item Co., Ltd. (603033.SS) Bundle
¿Busca determinar el valor intrínseco de Zhejiang Sanwei Rubber Artem Co., Ltd.? Nuestra calculadora DCF (603033SS) integra datos del mundo real con características integrales de personalización, lo que le permite ajustar los pronósticos y mejorar sus estrategias de inversión.
Discounted Cash Flow (DCF) - (USD MM)
| Year | AY1 2020 |
AY2 2021 |
AY3 2022 |
AY4 2023 |
AY5 2024 |
FY1 2025 |
FY2 2026 |
FY3 2027 |
FY4 2028 |
FY5 2029 |
|---|---|---|---|---|---|---|---|---|---|---|
| Revenue | 1,800.2 | 3,364.4 | 3,872.9 | 3,894.9 | 5,153.3 | 6,891.0 | 9,214.6 | 12,321.9 | 16,476.8 | 22,032.9 |
| Revenue Growth, % | 0 | 86.89 | 15.12 | 0.56859 | 32.31 | 33.72 | 33.72 | 33.72 | 33.72 | 33.72 |
| EBITDA | 407.7 | 396.5 | 440.8 | 472.3 | 371.7 | 897.9 | 1,200.7 | 1,605.6 | 2,147.0 | 2,870.9 |
| EBITDA, % | 22.65 | 11.79 | 11.38 | 12.13 | 7.21 | 13.03 | 13.03 | 13.03 | 13.03 | 13.03 |
| Depreciation | 74.7 | 187.2 | 209.3 | 223.0 | 246.1 | 353.1 | 472.1 | 631.3 | 844.2 | 1,128.9 |
| Depreciation, % | 4.15 | 5.57 | 5.4 | 5.72 | 4.78 | 5.12 | 5.12 | 5.12 | 5.12 | 5.12 |
| EBIT | 333.0 | 209.3 | 231.5 | 249.4 | 125.6 | 544.8 | 728.6 | 974.2 | 1,302.8 | 1,742.1 |
| EBIT, % | 18.5 | 6.22 | 5.98 | 6.4 | 2.44 | 7.91 | 7.91 | 7.91 | 7.91 | 7.91 |
| Total Cash | 332.7 | 466.7 | 547.1 | 262.4 | 332.4 | 822.3 | 1,099.6 | 1,470.4 | 1,966.2 | 2,629.2 |
| Total Cash, percent | .0 | .0 | .0 | .0 | .0 | .0 | .0 | .0 | .0 | .0 |
| Account Receivables | 1,177.5 | 1,617.3 | 1,343.5 | 1,301.0 | 1,224.5 | 2,829.9 | 3,784.2 | 5,060.2 | 6,766.5 | 9,048.2 |
| Account Receivables, % | 65.41 | 48.07 | 34.69 | 33.4 | 23.76 | 41.07 | 41.07 | 41.07 | 41.07 | 41.07 |
| Inventories | 413.6 | 504.3 | 553.4 | 623.7 | 551.2 | 1,088.2 | 1,455.2 | 1,945.9 | 2,602.1 | 3,479.5 |
| Inventories, % | 22.97 | 14.99 | 14.29 | 16.01 | 10.7 | 15.79 | 15.79 | 15.79 | 15.79 | 15.79 |
| Accounts Payable | 282.8 | 553.6 | 478.9 | 1,515.2 | 1,656.9 | 1,593.0 | 2,130.1 | 2,848.4 | 3,808.9 | 5,093.3 |
| Accounts Payable, % | 15.71 | 16.46 | 12.36 | 38.9 | 32.15 | 23.12 | 23.12 | 23.12 | 23.12 | 23.12 |
| Capital Expenditure | -517.5 | -269.3 | -1,353.2 | -2,645.8 | -484.7 | -2,053.9 | -2,746.5 | -3,672.6 | -4,911.0 | -6,567.1 |
| Capital Expenditure, % | -28.75 | -8.01 | -34.94 | -67.93 | -9.41 | -29.81 | -29.81 | -29.81 | -29.81 | -29.81 |
| Tax Rate, % | -39.2 | -39.2 | -39.2 | -39.2 | -39.2 | -39.2 | -39.2 | -39.2 | -39.2 | -39.2 |
| EBITAT | 249.3 | 137.6 | 176.1 | 171.0 | 174.9 | 419.8 | 561.4 | 750.7 | 1,003.8 | 1,342.3 |
| Depreciation | ||||||||||
| Changes in Account Receivables | ||||||||||
| Changes in Inventories | ||||||||||
| Changes in Accounts Payable | ||||||||||
| Capital Expenditure | ||||||||||
| UFCF | -1,501.8 | -204.1 | -818.0 | -1,243.4 | 227.0 | -3,487.4 | -2,497.0 | -3,339.1 | -4,465.0 | -5,970.6 |
| WACC, % | 10.7 | 10.61 | 10.71 | 10.64 | 10.94 | 10.72 | 10.72 | 10.72 | 10.72 | 10.72 |
| PV UFCF | ||||||||||
| SUM PV UFCF | -14,205.8 | |||||||||
| Long Term Growth Rate, % | 2.00 | |||||||||
| Free cash flow (T + 1) | -6,090 | |||||||||
| Terminal Value | -69,833 | |||||||||
| Present Terminal Value | -41,967 | |||||||||
| Enterprise Value | -56,173 | |||||||||
| Net Debt | 3,822 | |||||||||
| Equity Value | -59,995 | |||||||||
| Diluted Shares Outstanding, MM | 1,048 | |||||||||
| Equity Value Per Share | -57.22 |
Benefits You Will Receive
- Genuine Sanwei Financial Data: Access to historical and projected figures for precise valuation of (603033SS).
- Customizable Inputs: Adjust variables like WACC, tax rates, revenue growth, and capital expenditures to suit your analysis.
- Automatic Calculations: Obtain real-time intrinsic value and NPV calculations.
- Scenario Analysis: Explore various scenarios to assess the future outlook of Zhejiang Sanwei.
- User-Friendly Design: Crafted for industry experts while remaining approachable for newcomers.
Key Features
- Customizable Forecast Inputs: Adjust essential parameters such as revenue growth, EBITDA percentage, and capital expenditures to fit your analysis.
- Instant DCF Valuation: Calculates intrinsic value, net present value, and additional metrics with immediate results.
- High-Precision Accuracy: Leverages Zhejiang Sanwei Rubber Item Co., Ltd.'s (603033SS) actual financial data for credible valuation results.
- Effortless Scenario Analysis: Easily test various assumptions and compare different outcomes for informed decision-making.
- Time-Efficient Solution: Remove the hassle of constructing intricate valuation models from the ground up.
How It Works
- Step 1: Download the Excel file.
- Step 2: Review the pre-filled data for Zhejiang Sanwei Rubber Item Co., Ltd. (603033SS) (historical and projected).
- Step 3: Modify the key assumptions (highlighted in yellow) according to your analysis.
- Step 4: Observe the automatic recalculations for the intrinsic value of Zhejiang Sanwei Rubber Item Co., Ltd. (603033SS).
- Step 5: Utilize the results for investment decisions or financial reporting.
Why Choose This Tool for Zhejiang Sanwei Rubber Item Co., Ltd. (603033SS)?
- Designed for Industry Experts: A sophisticated tool utilized by analysts, financial officers, and industry consultants.
- Accurate Market Data: Historical and projected financial information for Zhejiang Sanwei Rubber Item Co., Ltd. preloaded to ensure precision.
- Flexible Scenario Analysis: Effortlessly test various forecasts and assumptions.
- Comprehensive Results: Automatically computes intrinsic value, NPV, and other essential metrics.
- User-Friendly Interface: Step-by-step guidance simplifies the entire process.
Who Can Benefit from This Product?
- Individual Investors: Make well-informed decisions regarding investments in Zhejiang Sanwei Rubber Item Co., Ltd. (603033SS).
- Financial Analysts: Enhance your valuation processes with comprehensive financial models tailored for the rubber industry.
- Consultants: Provide clients with accurate valuation insights for Zhejiang Sanwei Rubber Item Co., Ltd. (603033SS) efficiently.
- Business Owners: Gain insights into how companies like Zhejiang Sanwei Rubber Item Co., Ltd. (603033SS) are valued to inform your own business strategies.
- Finance Students: Acquire practical valuation skills using real data and scenarios related to Zhejiang Sanwei Rubber Item Co., Ltd. (603033SS).
Contents of the Template
- Pre-Filled Data: Features historical financials and projections for Zhejiang Sanwei Rubber Item Co., Ltd. (603033SS).
- Discounted Cash Flow Model: An editable DCF valuation model with automatic calculation capabilities.
- Weighted Average Cost of Capital (WACC): A dedicated worksheet for calculating WACC using tailored inputs.
- Key Financial Ratios: Assess profitability, efficiency, and leverage metrics for Zhejiang Sanwei Rubber Item Co., Ltd. (603033SS).
- Customizable Inputs: Easily modify revenue growth, profit margins, and tax rates.
- Clear Dashboard: Visual representations through charts and tables to summarize key valuation metrics.
Disclaimer
All information, articles, and product details provided on this website are for general informational and educational purposes only. We do not claim any ownership over, nor do we intend to infringe upon, any trademarks, copyrights, logos, brand names, or other intellectual property mentioned or depicted on this site. Such intellectual property remains the property of its respective owners, and any references here are made solely for identification or informational purposes, without implying any affiliation, endorsement, or partnership.
We make no representations or warranties, express or implied, regarding the accuracy, completeness, or suitability of any content or products presented. Nothing on this website should be construed as legal, tax, investment, financial, medical, or other professional advice. In addition, no part of this site—including articles or product references—constitutes a solicitation, recommendation, endorsement, advertisement, or offer to buy or sell any securities, franchises, or other financial instruments, particularly in jurisdictions where such activity would be unlawful.
All content is of a general nature and may not address the specific circumstances of any individual or entity. It is not a substitute for professional advice or services. Any actions you take based on the information provided here are strictly at your own risk. You accept full responsibility for any decisions or outcomes arising from your use of this website and agree to release us from any liability in connection with your use of, or reliance upon, the content or products found herein.