
|
Zhe Jiang Taihua New Material Co., Ltd. (603055.ss) Valoración de DCF |
Completamente Editable: Adáptelo A Sus Necesidades En Excel O Sheets
Diseño Profesional: Plantillas Confiables Y Estándares De La Industria
Predeterminadas Para Un Uso Rápido Y Eficiente
Compatible con MAC / PC, completamente desbloqueado
No Se Necesita Experiencia; Fáciles De Seguir
Zhe Jiang Taihua New Material Co., Ltd. (603055.SS) Bundle
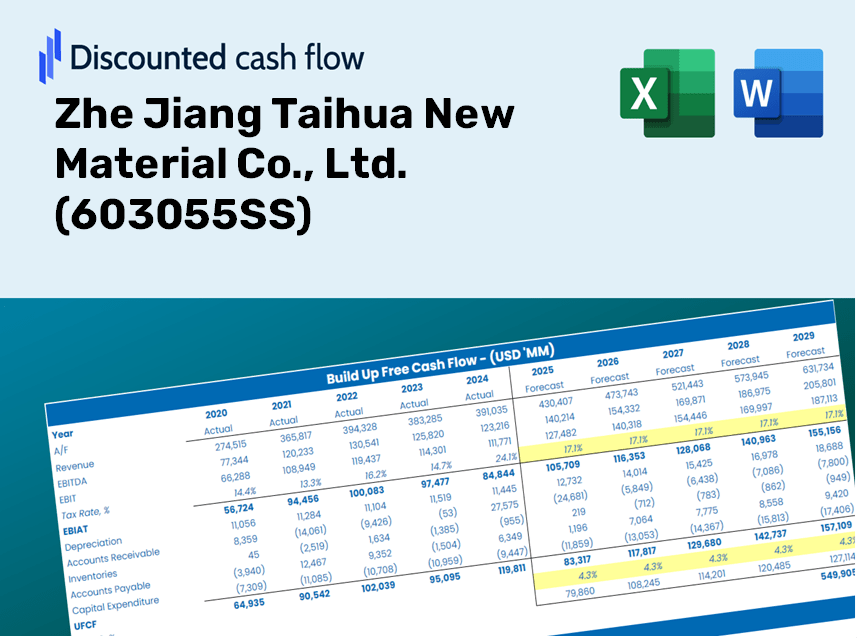
¡Simplifique Zhe Jiang Taihua New Material Co., Ltd. (603055SS) Valoración con esta calculadora DCF personalizable! Con el verdadero Zhe Jiang Taihua New Material Co., Ltd. (603055SS) Financials y las entradas de pronóstico ajustables, puede probar escenarios y descubrir Zhe Jiang Taihua New Material Co., Ltd. (603055ss) valor razonable en minutos.
Discounted Cash Flow (DCF) - (USD MM)
| Year | AY1 2020 |
AY2 2021 |
AY3 2022 |
AY4 2023 |
AY5 2024 |
FY1 2025 |
FY2 2026 |
FY3 2027 |
FY4 2028 |
FY5 2029 |
|---|---|---|---|---|---|---|---|---|---|---|
| Revenue | 2,501.1 | 4,256.6 | 4,008.6 | 5,093.9 | 7,120.1 | 9,455.7 | 12,557.4 | 16,676.6 | 22,147.1 | 29,411.9 |
| Revenue Growth, % | 0 | 70.19 | -5.83 | 27.07 | 39.78 | 32.8 | 32.8 | 32.8 | 32.8 | 32.8 |
| EBITDA | 416.8 | 893.1 | 712.6 | 935.1 | 1,401.7 | 1,767.6 | 2,347.4 | 3,117.5 | 4,140.1 | 5,498.2 |
| EBITDA, % | 16.67 | 20.98 | 17.78 | 18.36 | 19.69 | 18.69 | 18.69 | 18.69 | 18.69 | 18.69 |
| Depreciation | 234.4 | 305.8 | 332.6 | 361.6 | 442.0 | 721.7 | 958.4 | 1,272.8 | 1,690.3 | 2,244.7 |
| Depreciation, % | 9.37 | 7.18 | 8.3 | 7.1 | 6.21 | 7.63 | 7.63 | 7.63 | 7.63 | 7.63 |
| EBIT | 182.4 | 587.3 | 380.0 | 573.6 | 959.6 | 1,045.9 | 1,389.0 | 1,844.7 | 2,449.8 | 3,253.4 |
| EBIT, % | 7.29 | 13.8 | 9.48 | 11.26 | 13.48 | 11.06 | 11.06 | 11.06 | 11.06 | 11.06 |
| Total Cash | 441.2 | 516.2 | 565.9 | 765.8 | 1,030.5 | 1,387.9 | 1,843.2 | 2,447.9 | 3,250.8 | 4,317.2 |
| Total Cash, percent | .0 | .0 | .0 | .0 | .0 | .0 | .0 | .0 | .0 | .0 |
| Account Receivables | 654.0 | 945.4 | 727.8 | 1,405.9 | 1,560.1 | 2,194.2 | 2,914.0 | 3,869.9 | 5,139.3 | 6,825.1 |
| Account Receivables, % | 26.15 | 22.21 | 18.16 | 27.6 | 21.91 | 23.21 | 23.21 | 23.21 | 23.21 | 23.21 |
| Inventories | 964.3 | 1,381.3 | 1,584.9 | 1,977.9 | 2,354.3 | 3,450.1 | 4,581.9 | 6,084.9 | 8,080.9 | 10,731.7 |
| Inventories, % | 38.55 | 32.45 | 39.54 | 38.83 | 33.07 | 36.49 | 36.49 | 36.49 | 36.49 | 36.49 |
| Accounts Payable | 939.2 | 1,162.1 | 1,479.0 | 1,097.8 | 1,823.7 | 2,816.2 | 3,740.0 | 4,966.8 | 6,596.1 | 8,759.8 |
| Accounts Payable, % | 37.55 | 27.3 | 36.9 | 21.55 | 25.61 | 29.78 | 29.78 | 29.78 | 29.78 | 29.78 |
| Capital Expenditure | -962.5 | -507.8 | -1,123.0 | -1,772.0 | -670.4 | -2,319.1 | -3,079.8 | -4,090.1 | -5,431.8 | -7,213.6 |
| Capital Expenditure, % | -38.48 | -11.93 | -28.02 | -34.79 | -9.42 | -24.53 | -24.53 | -24.53 | -24.53 | -24.53 |
| Tax Rate, % | 10.7 | 10.7 | 10.7 | 10.7 | 10.7 | 10.7 | 10.7 | 10.7 | 10.7 | 10.7 |
| EBITAT | 170.7 | 527.2 | 350.2 | 536.1 | 857.0 | 958.6 | 1,273.1 | 1,690.7 | 2,245.3 | 2,981.9 |
| Depreciation | ||||||||||
| Changes in Account Receivables | ||||||||||
| Changes in Inventories | ||||||||||
| Changes in Accounts Payable | ||||||||||
| Capital Expenditure | ||||||||||
| UFCF | -1,236.4 | -160.2 | -109.6 | -2,326.5 | 823.8 | -1,376.2 | -1,776.1 | -2,358.7 | -3,132.4 | -4,159.9 |
| WACC, % | 4.48 | 4.43 | 4.46 | 4.48 | 4.42 | 4.45 | 4.45 | 4.45 | 4.45 | 4.45 |
| PV UFCF | ||||||||||
| SUM PV UFCF | -10,992.7 | |||||||||
| Long Term Growth Rate, % | 4.00 | |||||||||
| Free cash flow (T + 1) | -4,326 | |||||||||
| Terminal Value | -958,159 | |||||||||
| Present Terminal Value | -770,662 | |||||||||
| Enterprise Value | -781,655 | |||||||||
| Net Debt | 2,465 | |||||||||
| Equity Value | -784,120 | |||||||||
| Diluted Shares Outstanding, MM | 896 | |||||||||
| Equity Value Per Share | -875.18 |
What You Will Receive
- Authentic Zhe Jiang Taihua Data: Preloaded financials – encompassing revenue to EBIT – based on both actual and projected metrics.
- Comprehensive Customization: Modify all key parameters (yellow cells) such as WACC, growth %, and tax rates to suit your analysis.
- Instant Valuation Adjustments: Automatic recalculations to evaluate how changes affect the fair value of Zhe Jiang Taihua New Material Co., Ltd. (603055SS).
- Flexible Excel Template: Designed for effortless edits, scenario analysis, and thorough projections.
- Efficient and Precise: Eliminate the need to create models from scratch while ensuring accuracy and adaptability.
Key Features
- Pre-Loaded Data: Historical financial statements and pre-filled forecasts for Zhe Jiang Taihua New Material Co., Ltd. (603055SS).
- Fully Adjustable Inputs: Modify WACC, tax rates, revenue growth, and EBITDA margins as needed.
- Instant Results: Watch the intrinsic value of Zhe Jiang Taihua New Material Co., Ltd. (603055SS) update in real time.
- Clear Visual Outputs: Dashboard charts showcase valuation results and essential metrics.
- Built for Accuracy: A professional-grade tool designed for analysts, investors, and finance professionals.
How It Works
- Step 1: Download the prebuilt Excel template featuring Zhe Jiang Taihua New Material Co., Ltd.'s (603055SS) data.
- Step 2: Navigate through the pre-filled sheets to familiarize yourself with the key metrics.
- Step 3: Modify the forecasts and assumptions in the editable yellow cells (WACC, growth rates, and margins).
- Step 4: Instantly access the recalculated results, which include Zhe Jiang Taihua New Material Co., Ltd.'s (603055SS) intrinsic value.
- Step 5: Make well-informed investment decisions or produce reports based on the generated outputs.
Why Select This Calculator for Zhe Jiang Taihua New Material Co., Ltd. (603055SS)?
- Designed for Experts: A sophisticated tool tailored for analysts, CFOs, and consultants.
- Comprehensive Data: Historical and forecasted financials for Zhe Jiang Taihua New Material Co., Ltd. preloaded for precision.
- Flexible Scenario Analysis: Effortlessly test various forecasts and assumptions.
- Transparent Outputs: Instantly computes intrinsic value, NPV, and essential metrics.
- User-Friendly: Easy-to-follow instructions that walk you through each step of the process.
Who Can Benefit from This Product?
- Investors: Gain a precise estimate of Zhe Jiang Taihua New Material Co., Ltd. (603055SS)'s fair value prior to making investment choices.
- Chief Financial Officers: Utilize a high-quality DCF model for enhanced financial reporting and analysis.
- Consultants: Effortlessly customize the template for client valuation reports.
- Entrepreneurs: Acquire valuable insights into financial modeling practices used by leading firms.
- Educators: Employ this resource as a teaching aid to illustrate valuation techniques.
Contents of the Template
- Pre-Filled Data: Features historical financial data and projections for Zhe Jiang Taihua New Material Co., Ltd. (603055SS).
- Discounted Cash Flow Model: Editable DCF valuation model with automated calculations for easy analysis.
- Weighted Average Cost of Capital (WACC): A dedicated sheet for calculating WACC using your custom inputs.
- Key Financial Ratios: Evaluate Zhe Jiang Taihua's profitability, efficiency, and capital structure.
- Customizable Inputs: Easily adjust revenue growth, profit margins, and tax rates.
- Clear Dashboard: Visuals including charts and tables that summarize essential valuation outcomes.
Disclaimer
All information, articles, and product details provided on this website are for general informational and educational purposes only. We do not claim any ownership over, nor do we intend to infringe upon, any trademarks, copyrights, logos, brand names, or other intellectual property mentioned or depicted on this site. Such intellectual property remains the property of its respective owners, and any references here are made solely for identification or informational purposes, without implying any affiliation, endorsement, or partnership.
We make no representations or warranties, express or implied, regarding the accuracy, completeness, or suitability of any content or products presented. Nothing on this website should be construed as legal, tax, investment, financial, medical, or other professional advice. In addition, no part of this site—including articles or product references—constitutes a solicitation, recommendation, endorsement, advertisement, or offer to buy or sell any securities, franchises, or other financial instruments, particularly in jurisdictions where such activity would be unlawful.
All content is of a general nature and may not address the specific circumstances of any individual or entity. It is not a substitute for professional advice or services. Any actions you take based on the information provided here are strictly at your own risk. You accept full responsibility for any decisions or outcomes arising from your use of this website and agree to release us from any liability in connection with your use of, or reliance upon, the content or products found herein.