
|
Sichuan Hebang Biotechnology Corporation Limited (603077.SS) Valoración de DCF |
Completamente Editable: Adáptelo A Sus Necesidades En Excel O Sheets
Diseño Profesional: Plantillas Confiables Y Estándares De La Industria
Predeterminadas Para Un Uso Rápido Y Eficiente
Compatible con MAC / PC, completamente desbloqueado
No Se Necesita Experiencia; Fáciles De Seguir
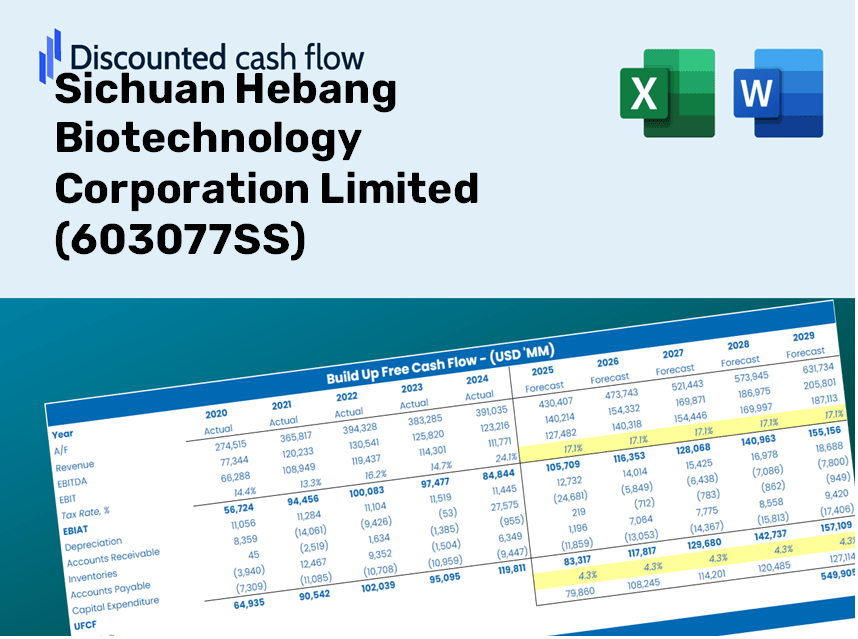
Sichuan Hebang Biotechnology Corporation Limited (603077.SS) Bundle
¡Evalúe la perspectiva financiera de Sichuan Hebang Biotechnology Corporation Limited como un experto! Esta calculadora DCF (603077SS) proporciona datos financieros preconsados junto con la flexibilidad para modificar el crecimiento de los ingresos, WACC, los márgenes y otros supuestos esenciales para que coincidan con sus proyecciones.
Discounted Cash Flow (DCF) - (USD MM)
| Year | AY1 2020 |
AY2 2021 |
AY3 2022 |
AY4 2023 |
AY5 2024 |
FY1 2025 |
FY2 2026 |
FY3 2027 |
FY4 2028 |
FY5 2029 |
|---|---|---|---|---|---|---|---|---|---|---|
| Revenue | 5,260.8 | 9,867.1 | 13,038.9 | 8,824.1 | 8,547.5 | 10,347.7 | 12,527.1 | 15,165.5 | 18,359.5 | 22,226.3 |
| Revenue Growth, % | 0 | 87.56 | 32.15 | -32.33 | -3.13 | 21.06 | 21.06 | 21.06 | 21.06 | 21.06 |
| EBITDA | 743.7 | 4,300.1 | 5,441.7 | 2,517.1 | 924.3 | 2,872.3 | 3,477.3 | 4,209.6 | 5,096.2 | 6,169.6 |
| EBITDA, % | 14.14 | 43.58 | 41.73 | 28.52 | 10.81 | 27.76 | 27.76 | 27.76 | 27.76 | 27.76 |
| Depreciation | 645.3 | 645.2 | 930.8 | 1,003.7 | 974.7 | 1,008.3 | 1,220.7 | 1,477.7 | 1,789.0 | 2,165.8 |
| Depreciation, % | 12.27 | 6.54 | 7.14 | 11.37 | 11.4 | 9.74 | 9.74 | 9.74 | 9.74 | 9.74 |
| EBIT | 98.4 | 3,655.0 | 4,510.9 | 1,513.4 | -50.4 | 1,864.0 | 2,256.6 | 2,731.9 | 3,307.3 | 4,003.8 |
| EBIT, % | 1.87 | 37.04 | 34.6 | 17.15 | -0.59 | 18.01 | 18.01 | 18.01 | 18.01 | 18.01 |
| Total Cash | 845.9 | 1,767.9 | 4,591.3 | 3,064.1 | 6,999.4 | 3,845.7 | 4,655.6 | 5,636.1 | 6,823.2 | 8,260.3 |
| Total Cash, percent | .0 | .0 | .0 | .0 | .0 | .0 | .0 | .0 | .0 | .0 |
| Account Receivables | 1,681.8 | 1,655.9 | 2,568.2 | 2,049.2 | 2,072.9 | 2,399.0 | 2,904.3 | 3,516.0 | 4,256.5 | 5,153.0 |
| Account Receivables, % | 31.97 | 16.78 | 19.7 | 23.22 | 24.25 | 23.18 | 23.18 | 23.18 | 23.18 | 23.18 |
| Inventories | 633.3 | 912.2 | 2,076.0 | 4,403.1 | 4,544.9 | 2,903.1 | 3,514.5 | 4,254.7 | 5,150.8 | 6,235.6 |
| Inventories, % | 12.04 | 9.24 | 15.92 | 49.9 | 53.17 | 28.06 | 28.06 | 28.06 | 28.06 | 28.06 |
| Accounts Payable | 1,041.8 | 1,156.1 | 1,877.5 | 1,877.5 | 2,107.6 | 1,901.0 | 2,301.3 | 2,786.0 | 3,372.8 | 4,083.2 |
| Accounts Payable, % | 19.8 | 11.72 | 14.4 | 21.28 | 24.66 | 18.37 | 18.37 | 18.37 | 18.37 | 18.37 |
| Capital Expenditure | -197.1 | -1,735.1 | -936.2 | -828.7 | -1,116.2 | -1,054.7 | -1,276.8 | -1,545.7 | -1,871.3 | -2,265.4 |
| Capital Expenditure, % | -3.75 | -17.58 | -7.18 | -9.39 | -13.06 | -10.19 | -10.19 | -10.19 | -10.19 | -10.19 |
| Tax Rate, % | 147.9 | 147.9 | 147.9 | 147.9 | 147.9 | 147.9 | 147.9 | 147.9 | 147.9 | 147.9 |
| EBITAT | 18.1 | 3,078.9 | 3,834.3 | 1,264.4 | 24.2 | 1,011.0 | 1,223.9 | 1,481.7 | 1,793.8 | 2,171.6 |
| Depreciation | ||||||||||
| Changes in Account Receivables | ||||||||||
| Changes in Inventories | ||||||||||
| Changes in Accounts Payable | ||||||||||
| Capital Expenditure | ||||||||||
| UFCF | -807.0 | 1,850.3 | 2,474.2 | -368.7 | -52.8 | 2,073.7 | 451.5 | 546.6 | 661.7 | 801.0 |
| WACC, % | 4.18 | 4.89 | 4.9 | 4.88 | 3.98 | 4.57 | 4.57 | 4.57 | 4.57 | 4.57 |
| PV UFCF | ||||||||||
| SUM PV UFCF | 4,068.3 | |||||||||
| Long Term Growth Rate, % | 0.50 | |||||||||
| Free cash flow (T + 1) | 805 | |||||||||
| Terminal Value | 19,802 | |||||||||
| Present Terminal Value | 15,840 | |||||||||
| Enterprise Value | 19,909 | |||||||||
| Net Debt | 304 | |||||||||
| Equity Value | 19,604 | |||||||||
| Diluted Shares Outstanding, MM | 8,504 | |||||||||
| Equity Value Per Share | 2.31 |
Benefits You Will Receive
- Pre-Filled Financial Model: Sichuan Hebang Biotechnology Corporation Limited's (603077SS) actual data provides an accurate DCF valuation.
- Comprehensive Forecast Control: Easily modify revenue growth, profit margins, WACC, and other essential metrics.
- Real-Time Calculations: Automatic updates allow you to view results immediately as adjustments are made.
- Professional-Grade Template: A polished Excel file crafted for high-quality valuations.
- Customizable and Reusable: Designed for adaptability, enabling multiple uses for in-depth financial forecasts.
Core Highlights
- Authentic Sichuan Hebang Financials: Gain access to reliable pre-loaded historical data and future estimations.
- Adjustable Forecast Parameters: Modify the yellow-highlighted fields, including WACC, growth rates, and profit margins.
- Real-Time Calculations: Enjoy automatic updates for DCF, Net Present Value (NPV), and cash flow assessments.
- User-Friendly Dashboard: Intuitive charts and summaries to help visualize your valuation findings.
- Designed for All Levels: A straightforward and intuitive design suitable for investors, CFOs, and consultants alike.
How It Works
- Step 1: Download the prebuilt Excel template containing Sichuan Hebang Biotechnology Corporation Limited's (603077SS) data.
- Step 2: Review the pre-filled sheets to familiarize yourself with the key performance indicators.
- Step 3: Adjust forecasts and assumptions in the editable yellow cells (WACC, growth, margins).
- Step 4: Instantly see the updated results, which include the intrinsic value of Sichuan Hebang Biotechnology Corporation Limited (603077SS).
- Step 5: Utilize the outputs to make well-informed investment decisions or create comprehensive reports.
Why Choose This Calculator for Sichuan Hebang Biotechnology Corporation Limited (603077SS)?
- Accuracy: Leverages real financial data from Sichuan Hebang for unparalleled precision.
- Flexibility: Allows users to easily experiment with and adjust variables as needed.
- Time-Saving: Eliminate the complexity of constructing a DCF model from the ground up.
- Professional-Grade: Crafted with the precision and functionality expected by CFOs.
- User-Friendly: Intuitive interface designed for users of all financial backgrounds.
Who Should Use This Product?
- Individual Investors: Gain insights to make educated decisions regarding the buying or selling of Sichuan Hebang Biotechnology Corporation Limited (603077SS) stock.
- Financial Analysts: Enhance valuation workflows with accessible financial models tailored for Sichuan Hebang Biotechnology Corporation Limited (603077SS).
- Consultants: Provide clients with precise valuation insights on Sichuan Hebang Biotechnology Corporation Limited (603077SS) efficiently and effectively.
- Business Owners: Learn how major companies like Sichuan Hebang Biotechnology Corporation Limited (603077SS) are valued to inform your strategic planning.
- Finance Students: Master valuation methodologies using real data and case studies related to Sichuan Hebang Biotechnology Corporation Limited (603077SS).
Contents of the Template for Sichuan Hebang Biotechnology Corporation Limited (603077SS)
- Preloaded 603077SS Data: Historical and projected financial metrics, encompassing revenue, EBIT, and capital expenditures.
- DCF and WACC Models: High-quality spreadsheets designed for calculating intrinsic value and Weighted Average Cost of Capital.
- Editable Inputs: Cells highlighted in yellow for modifying revenue growth rates, tax rates, and discount rates.
- Financial Statements: Detailed annual and quarterly financial statements for comprehensive analysis.
- Key Ratios: Ratios related to profitability, leverage, and efficiency for performance assessment.
- Dashboard and Charts: Visual representations of valuation results and underlying assumptions.
Disclaimer
All information, articles, and product details provided on this website are for general informational and educational purposes only. We do not claim any ownership over, nor do we intend to infringe upon, any trademarks, copyrights, logos, brand names, or other intellectual property mentioned or depicted on this site. Such intellectual property remains the property of its respective owners, and any references here are made solely for identification or informational purposes, without implying any affiliation, endorsement, or partnership.
We make no representations or warranties, express or implied, regarding the accuracy, completeness, or suitability of any content or products presented. Nothing on this website should be construed as legal, tax, investment, financial, medical, or other professional advice. In addition, no part of this site—including articles or product references—constitutes a solicitation, recommendation, endorsement, advertisement, or offer to buy or sell any securities, franchises, or other financial instruments, particularly in jurisdictions where such activity would be unlawful.
All content is of a general nature and may not address the specific circumstances of any individual or entity. It is not a substitute for professional advice or services. Any actions you take based on the information provided here are strictly at your own risk. You accept full responsibility for any decisions or outcomes arising from your use of this website and agree to release us from any liability in connection with your use of, or reliance upon, the content or products found herein.