
|
Nanhua Futures Co., Ltd. (603093.ss) Valoración de DCF |
Completamente Editable: Adáptelo A Sus Necesidades En Excel O Sheets
Diseño Profesional: Plantillas Confiables Y Estándares De La Industria
Predeterminadas Para Un Uso Rápido Y Eficiente
Compatible con MAC / PC, completamente desbloqueado
No Se Necesita Experiencia; Fáciles De Seguir
Nanhua Futures Co., Ltd. (603093.SS) Bundle
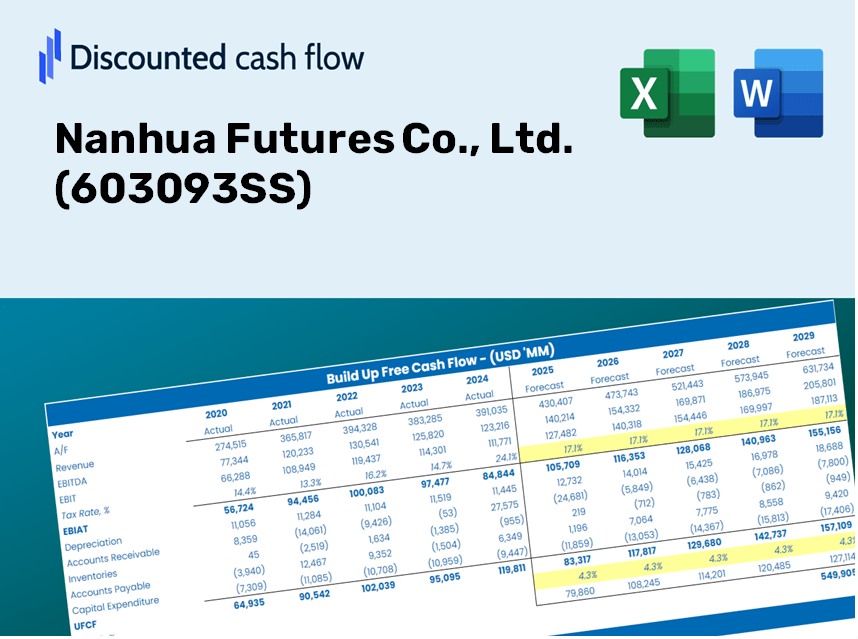
¡Evalúe las perspectivas financieras de Nanhua Futures Co., Ltd. como un experto! Esta calculadora DCF (603093SS) viene con finanzas pre-llenas y ofrece una flexibilidad completa para modificar el crecimiento de los ingresos, WACC, los márgenes y otros supuestos cruciales según sus proyecciones.
Discounted Cash Flow (DCF) - (USD MM)
| Year | AY1 2020 |
AY2 2021 |
AY3 2022 |
AY4 2023 |
AY5 2024 |
FY1 2025 |
FY2 2026 |
FY3 2027 |
FY4 2028 |
FY5 2029 |
|---|---|---|---|---|---|---|---|---|---|---|
| Revenue | 9,904.8 | 10,504.0 | 6,824.3 | 6,234.6 | 5,756.3 | 5,104.5 | 4,526.5 | 4,013.9 | 3,559.4 | 3,156.4 |
| Revenue Growth, % | 0 | 6.05 | -35.03 | -8.64 | -7.67 | -11.32 | -11.32 | -11.32 | -11.32 | -11.32 |
| EBITDA | 189.9 | 398.8 | 374.2 | 494.9 | .0 | 195.3 | 173.2 | 153.6 | 136.2 | 120.8 |
| EBITDA, % | 1.92 | 3.8 | 5.48 | 7.94 | 0 | 3.83 | 3.83 | 3.83 | 3.83 | 3.83 |
| Depreciation | 20.6 | 33.3 | 48.4 | 46.4 | 48.9 | 28.9 | 25.6 | 22.7 | 20.1 | 17.9 |
| Depreciation, % | 0.20846 | 0.31687 | 0.70966 | 0.74468 | 0.84915 | 0.56576 | 0.56576 | 0.56576 | 0.56576 | 0.56576 |
| EBIT | 169.3 | 365.6 | 325.8 | 448.4 | -48.9 | 166.5 | 147.6 | 130.9 | 116.1 | 102.9 |
| EBIT, % | 1.71 | 3.48 | 4.77 | 7.19 | -0.84915 | 3.26 | 3.26 | 3.26 | 3.26 | 3.26 |
| Total Cash | 11,625.5 | 16,632.3 | 17,626.8 | 1,920.0 | 33,853.9 | 4,398.0 | 3,900.0 | 3,458.4 | 3,066.8 | 2,719.5 |
| Total Cash, percent | .0 | .0 | .0 | .0 | .0 | .0 | .0 | .0 | .0 | .0 |
| Account Receivables | 8,189.9 | 10,806.5 | 12,632.4 | 11,262.2 | 11,825.9 | 4,927.7 | 4,369.7 | 3,874.9 | 3,436.2 | 3,047.1 |
| Account Receivables, % | 82.69 | 102.88 | 185.11 | 180.64 | 205.44 | 96.54 | 96.54 | 96.54 | 96.54 | 96.54 |
| Inventories | 325.3 | 226.8 | 150.5 | 112.0 | .0 | 96.4 | 85.5 | 75.8 | 67.2 | 59.6 |
| Inventories, % | 3.28 | 2.16 | 2.2 | 1.8 | 0 | 1.89 | 1.89 | 1.89 | 1.89 | 1.89 |
| Accounts Payable | .0 | .0 | .6 | 41.3 | 11.4 | 8.9 | 7.9 | 7.0 | 6.2 | 5.5 |
| Accounts Payable, % | 0 | 0 | 0.00821825 | 0.66184 | 0.19728 | 0.17347 | 0.17347 | 0.17347 | 0.17347 | 0.17347 |
| Capital Expenditure | -75.8 | -59.0 | -31.7 | -52.8 | -11.0 | -28.9 | -25.6 | -22.7 | -20.1 | -17.9 |
| Capital Expenditure, % | -0.7655 | -0.56142 | -0.4647 | -0.84752 | -0.19023 | -0.56587 | -0.56587 | -0.56587 | -0.56587 | -0.56587 |
| Tax Rate, % | 12.21 | 12.21 | 12.21 | 12.21 | 12.21 | 12.21 | 12.21 | 12.21 | 12.21 | 12.21 |
| EBITAT | 125.3 | 267.7 | 271.9 | 401.9 | -42.9 | 135.9 | 120.5 | 106.9 | 94.8 | 84.0 |
| Depreciation | ||||||||||
| Changes in Account Receivables | ||||||||||
| Changes in Inventories | ||||||||||
| Changes in Accounts Payable | ||||||||||
| Capital Expenditure | ||||||||||
| UFCF | -8,445.0 | -2,276.0 | -1,460.5 | 1,844.8 | -486.6 | 6,935.1 | 688.4 | 610.5 | 541.3 | 480.0 |
| WACC, % | 8.22 | 8.22 | 8.25 | 8.27 | 8.27 | 8.25 | 8.25 | 8.25 | 8.25 | 8.25 |
| PV UFCF | ||||||||||
| SUM PV UFCF | 8,193.0 | |||||||||
| Long Term Growth Rate, % | 2.00 | |||||||||
| Free cash flow (T + 1) | 490 | |||||||||
| Terminal Value | 7,840 | |||||||||
| Present Terminal Value | 5,275 | |||||||||
| Enterprise Value | 13,468 | |||||||||
| Net Debt | -33,854 | |||||||||
| Equity Value | 47,322 | |||||||||
| Diluted Shares Outstanding, MM | 604 | |||||||||
| Equity Value Per Share | 78.30 |
Advantages You Will Receive
- Comprehensive Financial Model: Nanhua Futures Co., Ltd.'s actual data facilitates accurate DCF valuation.
- Complete Forecast Customization: Modify revenue growth, margins, WACC, and other essential parameters.
- Real-Time Calculations: Automatic updates provide immediate feedback as you make adjustments.
- Professional-Grade Template: A polished Excel file crafted for high-quality valuation work.
- Flexible and Reusable: Designed for adaptability, allowing for repeated use in detailed forecasting.
Key Features
- 🔍 Real-Life Nanhua Futures Financials: Pre-filled historical and projected data for Nanhua Futures Co., Ltd. (603093SS).
- ✏️ Fully Customizable Inputs: Adjust all key parameters (yellow cells) such as WACC, growth %, and tax rates.
- 📊 Professional DCF Valuation: Integrated formulas compute Nanhua’s intrinsic value using the Discounted Cash Flow method.
- ⚡ Instant Results: See Nanhua’s valuation in real-time after making adjustments.
- Scenario Analysis: Evaluate and contrast results for diverse financial assumptions side-by-side.
How It Functions
- Step 1: Download the Excel file.
- Step 2: Examine Nanhua Futures Co., Ltd.'s pre-filled financial data and projections.
- Step 3: Adjust key inputs such as revenue growth, WACC, and tax rates (highlighted cells).
- Step 4: Observe the DCF model update in real-time as you modify assumptions.
- Step 5: Evaluate the outputs and leverage the results for your investment choices.
Why Choose This Tool from Nanhua Futures Co., Ltd. (603093SS)?
- Designed for Experts: A sophisticated resource trusted by traders, portfolio managers, and market analysts.
- Up-to-Date Market Data: Comprehensive historical and forecasted financial insights tailored for accuracy.
- Flexible Scenario Analysis: Effortlessly explore various market conditions and assumptions.
- Insightful Results: Instantly computes key performance indicators, forecasts, and intrinsic values.
- User-Friendly Interface: Intuitive guidance helps you navigate the tool smoothly.
Who Can Benefit from Nanhua Futures Co., Ltd. (603093SS)?
- Finance Students: Explore futures trading concepts and apply theoretical knowledge to real market scenarios.
- Researchers: Integrate advanced trading models and analytical tools into studies related to derivatives.
- Traders: Validate your strategies and assess market trends using data from Nanhua Futures Co., Ltd. (603093SS).
- Market Analysts: Enhance your analysis with a comprehensive suite of tools tailored for futures market evaluation.
- Entrepreneurs: Understand how futures markets operate and gain insights into risk management strategies used by large firms.
What the Template Contains
- Pre-Filled DCF Model: Nanhua Futures Co., Ltd. (603093SS)’s financial data preloaded for immediate use.
- WACC Calculator: Comprehensive calculations for Weighted Average Cost of Capital.
- Financial Ratios: Assess Nanhua Futures Co., Ltd. (603093SS)’s profitability, leverage, and operational efficiency.
- Editable Inputs: Modify assumptions regarding growth, margins, and CAPEX to suit your analysis.
- Financial Statements: Access annual and quarterly reports for in-depth evaluation.
- Interactive Dashboard: Effortlessly visualize key valuation metrics and outcomes.
Disclaimer
All information, articles, and product details provided on this website are for general informational and educational purposes only. We do not claim any ownership over, nor do we intend to infringe upon, any trademarks, copyrights, logos, brand names, or other intellectual property mentioned or depicted on this site. Such intellectual property remains the property of its respective owners, and any references here are made solely for identification or informational purposes, without implying any affiliation, endorsement, or partnership.
We make no representations or warranties, express or implied, regarding the accuracy, completeness, or suitability of any content or products presented. Nothing on this website should be construed as legal, tax, investment, financial, medical, or other professional advice. In addition, no part of this site—including articles or product references—constitutes a solicitation, recommendation, endorsement, advertisement, or offer to buy or sell any securities, franchises, or other financial instruments, particularly in jurisdictions where such activity would be unlawful.
All content is of a general nature and may not address the specific circumstances of any individual or entity. It is not a substitute for professional advice or services. Any actions you take based on the information provided here are strictly at your own risk. You accept full responsibility for any decisions or outcomes arising from your use of this website and agree to release us from any liability in connection with your use of, or reliance upon, the content or products found herein.