
|
Chongqing Chuanyi Automation Co., Ltd. (603100.ss) Valoración de DCF |
Completamente Editable: Adáptelo A Sus Necesidades En Excel O Sheets
Diseño Profesional: Plantillas Confiables Y Estándares De La Industria
Predeterminadas Para Un Uso Rápido Y Eficiente
Compatible con MAC / PC, completamente desbloqueado
No Se Necesita Experiencia; Fáciles De Seguir
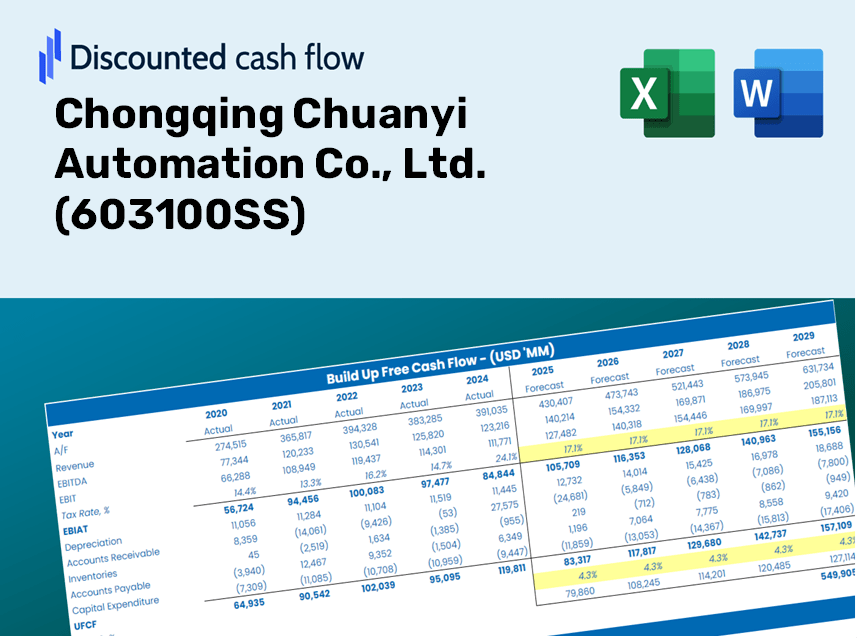
Chongqing Chuanyi Automation Co., Ltd. (603100.SS) Bundle
¡Evalúe la perspectiva financiera de Chongqing Chuanyi Automation Co., Ltd. como un experto! Esta calculadora DCF (603100SS) le proporciona datos financieros previamente llenos y una flexibilidad completa para modificar suposiciones como el crecimiento de los ingresos, WACC, los márgenes y otros factores cruciales para alinearse con sus pronósticos.
Discounted Cash Flow (DCF) - (USD MM)
| Year | AY1 2020 |
AY2 2021 |
AY3 2022 |
AY4 2023 |
AY5 2024 |
FY1 2025 |
FY2 2026 |
FY3 2027 |
FY4 2028 |
FY5 2029 |
|---|---|---|---|---|---|---|---|---|---|---|
| Revenue | 4,253.4 | 5,486.6 | 6,370.2 | 7,410.8 | 7,591.8 | 7,308.4 | 7,035.7 | 6,773.1 | 6,520.3 | 6,277.0 |
| Revenue Growth, % | 0 | 28.99 | 16.1 | 16.34 | 2.44 | -3.73 | -3.73 | -3.73 | -3.73 | -3.73 |
| EBITDA | 395.4 | 409.3 | 516.4 | 582.5 | 640.6 | 601.6 | 579.2 | 557.6 | 536.8 | 516.7 |
| EBITDA, % | 9.3 | 7.46 | 8.11 | 7.86 | 8.44 | 8.23 | 8.23 | 8.23 | 8.23 | 8.23 |
| Depreciation | 51.9 | 56.1 | 59.2 | 66.3 | 73.4 | 73.6 | 70.8 | 68.2 | 65.6 | 63.2 |
| Depreciation, % | 1.22 | 1.02 | 0.92986 | 0.89459 | 0.9666 | 1.01 | 1.01 | 1.01 | 1.01 | 1.01 |
| EBIT | 343.5 | 353.2 | 457.2 | 516.2 | 567.2 | 528.1 | 508.4 | 489.4 | 471.1 | 453.6 |
| EBIT, % | 8.08 | 6.44 | 7.18 | 6.97 | 7.47 | 7.23 | 7.23 | 7.23 | 7.23 | 7.23 |
| Total Cash | 1,179.5 | 1,816.9 | 2,150.9 | 2,537.1 | 2,685.8 | 2,400.5 | 2,310.9 | 2,224.6 | 2,141.6 | 2,061.7 |
| Total Cash, percent | .0 | .0 | .0 | .0 | .0 | .0 | .0 | .0 | .0 | .0 |
| Account Receivables | 2,065.5 | 1,911.4 | 2,142.9 | 2,397.8 | 2,657.1 | 2,695.3 | 2,594.7 | 2,497.8 | 2,404.6 | 2,314.9 |
| Account Receivables, % | 48.56 | 34.84 | 33.64 | 32.36 | 35 | 36.88 | 36.88 | 36.88 | 36.88 | 36.88 |
| Inventories | 852.6 | 1,146.5 | 1,299.6 | 1,402.9 | 1,127.2 | 1,390.4 | 1,338.5 | 1,288.5 | 1,240.4 | 1,194.1 |
| Inventories, % | 20.04 | 20.9 | 20.4 | 18.93 | 14.85 | 19.02 | 19.02 | 19.02 | 19.02 | 19.02 |
| Accounts Payable | 1,135.0 | 1,314.0 | 1,520.6 | 1,820.3 | 1,001.3 | 1,640.8 | 1,579.6 | 1,520.6 | 1,463.9 | 1,409.3 |
| Accounts Payable, % | 26.69 | 23.95 | 23.87 | 24.56 | 13.19 | 22.45 | 22.45 | 22.45 | 22.45 | 22.45 |
| Capital Expenditure | -60.0 | -100.5 | -102.7 | -145.7 | -83.0 | -115.7 | -111.4 | -107.2 | -103.2 | -99.4 |
| Capital Expenditure, % | -1.41 | -1.83 | -1.61 | -1.97 | -1.09 | -1.58 | -1.58 | -1.58 | -1.58 | -1.58 |
| Tax Rate, % | 9.9 | 9.9 | 9.9 | 9.9 | 9.9 | 9.9 | 9.9 | 9.9 | 9.9 | 9.9 |
| EBITAT | 306.0 | 313.4 | 414.5 | 470.2 | 511.0 | 474.9 | 457.2 | 440.1 | 423.7 | 407.9 |
| Depreciation | ||||||||||
| Changes in Account Receivables | ||||||||||
| Changes in Inventories | ||||||||||
| Changes in Accounts Payable | ||||||||||
| Capital Expenditure | ||||||||||
| UFCF | -1,485.2 | 308.1 | 193.0 | 332.4 | -301.3 | 771.1 | 507.9 | 488.9 | 470.7 | 453.1 |
| WACC, % | 9.24 | 9.24 | 9.25 | 9.25 | 9.24 | 9.24 | 9.24 | 9.24 | 9.24 | 9.24 |
| PV UFCF | ||||||||||
| SUM PV UFCF | 2,128.0 | |||||||||
| Long Term Growth Rate, % | 3.50 | |||||||||
| Free cash flow (T + 1) | 469 | |||||||||
| Terminal Value | 8,164 | |||||||||
| Present Terminal Value | 5,247 | |||||||||
| Enterprise Value | 7,375 | |||||||||
| Net Debt | -2,509 | |||||||||
| Equity Value | 9,884 | |||||||||
| Diluted Shares Outstanding, MM | 512 | |||||||||
| Equity Value Per Share | 19.31 |
What You Will Receive
- Accurate CQAI Financials: Access to historical and projected data for precise valuation.
- Customizable Inputs: Adjust WACC, tax rates, revenue growth, and capital expenditures as needed.
- Real-Time Calculations: Dynamic computation of intrinsic value and NPV.
- Scenario Analysis: Evaluate various scenarios to assess the future outlook of Chongqing Chuanyi Automation Co., Ltd. (603100SS).
- User-Friendly Interface: Designed for professionals while remaining easy for newcomers.
Core Features
- Authentic Financial Data: Gain access to reliable historical figures and future forecasts tailored for Chongqing Chuanyi Automation Co., Ltd. (603100SS).
- Adjustable Forecast Parameters: Modify highlighted cells, including WACC, growth rates, and profit margins, to suit your analysis.
- Instant Calculations: Real-time updates for DCF, Net Present Value (NPV), and cash flow evaluations.
- Interactive Dashboard: User-friendly charts and summaries to clearly present your valuation findings.
- Designed for All Skill Levels: An intuitive format catering to investors, CFOs, and consultants alike.
How It Functions
- Step 1: Download the preconfigured Excel template that includes data for Chongqing Chuanyi Automation Co., Ltd. (603100SS).
- Step 2: Review the populated sheets to grasp the essential metrics.
- Step 3: Modify forecasts and assumptions in the editable yellow cells (WACC, growth, margins).
- Step 4: Instantly observe the recalculated results, including the intrinsic value of Chongqing Chuanyi Automation Co., Ltd. (603100SS).
- Step 5: Utilize the outputs to make informed investment choices or create comprehensive reports.
Why Select This Calculator?
- User-Friendly Interface: Perfectly suited for both novices and seasoned professionals.
- Customizable Parameters: Effortlessly adjust inputs to tailor your analysis.
- Real-Time Valuation: Observe immediate updates on Chongqing Chuanyi Automation’s valuation as inputs are modified.
- Preloaded Data: Comes equipped with Chongqing Chuanyi Automation’s (603100SS) actual financial information for swift analysis.
- Relied Upon by Experts: A preferred tool for investors and analysts aiming for informed decision-making.
Who Can Benefit from This Product?
- Investors: Accurately assess Chongqing Chuanyi Automation's fair value before making investment choices.
- CFOs: Utilize a professional-grade DCF model for comprehensive financial analysis and reporting.
- Consultants: Effortlessly customize the template for client valuation reports.
- Entrepreneurs: Acquire valuable insights into financial modeling practices of industry leaders.
- Educators: Employ it as a teaching resource to illustrate valuation techniques.
Contents of the Template
- Operating and Balance Sheet Data: Pre-filled historical data and forecasts for Chongqing Chuanyi Automation Co., Ltd. (603100SS), including revenue, EBITDA, EBIT, and capital expenditures.
- WACC Calculation: A specific sheet for Weighted Average Cost of Capital (WACC), featuring parameters such as Beta, risk-free rate, and share price.
- DCF Valuation (Unlevered and Levered): Customizable Discounted Cash Flow models that provide intrinsic value calculations in detail.
- Financial Statements: Pre-loaded financial statements (annual and quarterly) available for comprehensive analysis.
- Key Ratios: Includes key financial ratios focusing on profitability, leverage, and efficiency for Chongqing Chuanyi Automation Co., Ltd. (603100SS).
- Dashboard and Charts: A visual summary of valuation outputs and underlying assumptions to facilitate easy result analysis.
Disclaimer
All information, articles, and product details provided on this website are for general informational and educational purposes only. We do not claim any ownership over, nor do we intend to infringe upon, any trademarks, copyrights, logos, brand names, or other intellectual property mentioned or depicted on this site. Such intellectual property remains the property of its respective owners, and any references here are made solely for identification or informational purposes, without implying any affiliation, endorsement, or partnership.
We make no representations or warranties, express or implied, regarding the accuracy, completeness, or suitability of any content or products presented. Nothing on this website should be construed as legal, tax, investment, financial, medical, or other professional advice. In addition, no part of this site—including articles or product references—constitutes a solicitation, recommendation, endorsement, advertisement, or offer to buy or sell any securities, franchises, or other financial instruments, particularly in jurisdictions where such activity would be unlawful.
All content is of a general nature and may not address the specific circumstances of any individual or entity. It is not a substitute for professional advice or services. Any actions you take based on the information provided here are strictly at your own risk. You accept full responsibility for any decisions or outcomes arising from your use of this website and agree to release us from any liability in connection with your use of, or reliance upon, the content or products found herein.