
|
Shanghai Runda Medical Technology Co., Ltd. (603108.SS) Valoración de DCF |
Completamente Editable: Adáptelo A Sus Necesidades En Excel O Sheets
Diseño Profesional: Plantillas Confiables Y Estándares De La Industria
Predeterminadas Para Un Uso Rápido Y Eficiente
Compatible con MAC / PC, completamente desbloqueado
No Se Necesita Experiencia; Fáciles De Seguir
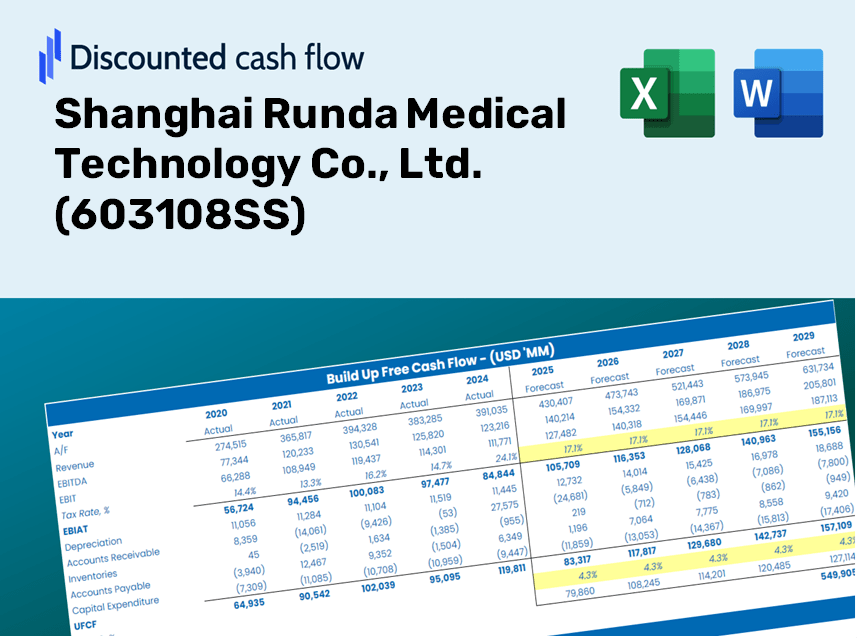
Shanghai Runda Medical Technology Co., Ltd. (603108.SS) Bundle
¡Simplifique la valoración de Shanghai Runda Medical Technology Co., Ltd. (603108SS) con esta calculadora DCF personalizable! Con el Real Shanghai Runda Medical Technology Co., Ltd. (603108SS) Financials y las entradas de pronóstico ajustables, puede probar escenarios y descubrir Shanghai Runda Medical Technology Co., Ltd. (603108SS) valor razonable en minutos.
Discounted Cash Flow (DCF) - (USD MM)
| Year | AY1 2020 |
AY2 2021 |
AY3 2022 |
AY4 2023 |
AY5 2024 |
FY1 2025 |
FY2 2026 |
FY3 2027 |
FY4 2028 |
FY5 2029 |
|---|---|---|---|---|---|---|---|---|---|---|
| Revenue | 7,069.2 | 8,860.1 | 10,494.4 | 9,147.4 | 8,311.8 | 8,765.0 | 9,242.9 | 9,746.8 | 10,278.3 | 10,838.7 |
| Revenue Growth, % | 0 | 25.33 | 18.45 | -12.84 | -9.13 | 5.45 | 5.45 | 5.45 | 5.45 | 5.45 |
| EBITDA | 1,038.9 | 1,240.2 | 1,285.8 | 1,031.0 | 872.9 | 1,099.5 | 1,159.4 | 1,222.6 | 1,289.3 | 1,359.6 |
| EBITDA, % | 14.7 | 14 | 12.25 | 11.27 | 10.5 | 12.54 | 12.54 | 12.54 | 12.54 | 12.54 |
| Depreciation | 302.7 | 291.1 | 307.7 | 317.5 | 316.8 | 311.7 | 328.7 | 346.6 | 365.5 | 385.4 |
| Depreciation, % | 4.28 | 3.29 | 2.93 | 3.47 | 3.81 | 3.56 | 3.56 | 3.56 | 3.56 | 3.56 |
| EBIT | 736.3 | 949.2 | 978.1 | 713.5 | 556.1 | 787.8 | 830.7 | 876.0 | 923.8 | 974.2 |
| EBIT, % | 10.42 | 10.71 | 9.32 | 7.8 | 6.69 | 8.99 | 8.99 | 8.99 | 8.99 | 8.99 |
| Total Cash | 1,004.5 | 1,049.0 | 1,113.6 | 1,126.1 | 1,288.7 | 1,130.2 | 1,191.9 | 1,256.9 | 1,325.4 | 1,397.7 |
| Total Cash, percent | .0 | .0 | .0 | .0 | .0 | .0 | .0 | .0 | .0 | .0 |
| Account Receivables | 3,618.0 | 4,501.4 | 6,280.2 | 5,913.3 | 5,531.5 | 5,136.7 | 5,416.7 | 5,712.1 | 6,023.5 | 6,352.0 |
| Account Receivables, % | 51.18 | 50.81 | 59.84 | 64.64 | 66.55 | 58.6 | 58.6 | 58.6 | 58.6 | 58.6 |
| Inventories | 1,153.7 | 1,502.4 | 1,615.9 | 1,377.0 | 1,323.4 | 1,396.3 | 1,472.4 | 1,552.7 | 1,637.4 | 1,726.6 |
| Inventories, % | 16.32 | 16.96 | 15.4 | 15.05 | 15.92 | 15.93 | 15.93 | 15.93 | 15.93 | 15.93 |
| Accounts Payable | 937.7 | 1,163.5 | 1,836.2 | 1,398.7 | 1,158.6 | 1,281.8 | 1,351.7 | 1,425.4 | 1,503.1 | 1,585.1 |
| Accounts Payable, % | 13.26 | 13.13 | 17.5 | 15.29 | 13.94 | 14.62 | 14.62 | 14.62 | 14.62 | 14.62 |
| Capital Expenditure | -331.9 | -301.1 | -272.1 | -319.9 | -229.2 | -297.0 | -313.2 | -330.2 | -348.2 | -367.2 |
| Capital Expenditure, % | -4.7 | -3.4 | -2.59 | -3.5 | -2.76 | -3.39 | -3.39 | -3.39 | -3.39 | -3.39 |
| Tax Rate, % | 84 | 84 | 84 | 84 | 84 | 84 | 84 | 84 | 84 | 84 |
| EBITAT | 382.1 | 462.4 | 498.5 | 297.5 | 89.0 | 329.7 | 347.7 | 366.7 | 386.7 | 407.7 |
| Depreciation | ||||||||||
| Changes in Account Receivables | ||||||||||
| Changes in Inventories | ||||||||||
| Changes in Accounts Payable | ||||||||||
| Capital Expenditure | ||||||||||
| UFCF | -3,481.2 | -553.9 | -685.4 | 463.4 | 371.8 | 789.6 | 76.9 | 81.1 | 85.5 | 90.2 |
| WACC, % | 5.79 | 5.72 | 5.77 | 5.59 | 5.08 | 5.59 | 5.59 | 5.59 | 5.59 | 5.59 |
| PV UFCF | ||||||||||
| SUM PV UFCF | 1,023.2 | |||||||||
| Long Term Growth Rate, % | 3.50 | |||||||||
| Free cash flow (T + 1) | 93 | |||||||||
| Terminal Value | 4,469 | |||||||||
| Present Terminal Value | 3,405 | |||||||||
| Enterprise Value | 4,428 | |||||||||
| Net Debt | 4,679 | |||||||||
| Equity Value | -251 | |||||||||
| Diluted Shares Outstanding, MM | 614 | |||||||||
| Equity Value Per Share | -0.41 |
What You Will Receive
- Authentic Runda Data: Comprehensive financials – from revenue to EBIT – derived from actual and forecasted figures.
- Complete Customization: Modify all key parameters (yellow cells) such as WACC, growth %, and tax rates.
- Instant Valuation Adjustments: Automatic recalculations to assess the impact of changes on Shanghai Runda Medical Technology's fair value.
- Flexible Excel Template: Designed for quick modifications, scenario analysis, and in-depth projections.
- Efficient and Precise: Eliminate the need to create models from the ground up while ensuring accuracy and adaptability.
Key Features
- Real-Time SH Runda Data: Comes pre-loaded with Shanghai Runda Medical Technology’s historical performance and future projections.
- Comprehensive Customization: Tailor inputs for revenue growth, profit margins, WACC, tax rates, and capital expenditure plans.
- Interactive Valuation Framework: Automatically refreshes Net Present Value (NPV) and intrinsic value based on your variables.
- Flexible Scenario Analysis: Generate multiple forecasting scenarios to explore various valuation possibilities.
- Intuitive User Interface: Designed with simplicity, making it accessible for both professionals and newcomers.
How It Operates
- Step 1: Download the preconfigured Excel template containing data for Shanghai Runda Medical Technology Co., Ltd. (603108SS).
- Step 2: Navigate through the pre-populated sheets to familiarize yourself with the essential metrics.
- Step 3: Modify the forecasts and assumptions in the editable yellow cells (WACC, growth rate, profit margins).
- Step 4: Immediately see the updated results, including the intrinsic value of Shanghai Runda Medical Technology Co., Ltd. (603108SS).
- Step 5: Utilize the outputs to make well-informed investment choices or to create comprehensive reports.
Why Opt for Our Calculator?
- Time-Efficient: Skip the hassle of building a DCF model from scratch – it's ready for immediate use.
- Enhanced Accuracy: Dependable financial data and formulas minimize valuation errors.
- Fully Customizable: Adjust the model to align with your specific assumptions and forecasts.
- User-Friendly: Intuitive charts and outputs simplify the analysis of results.
- Endorsed by Professionals: Created for experts who prioritize accuracy and functionality.
Who Can Benefit from This Product?
- Healthcare Investors: Develop comprehensive and accurate valuation models for investment analysis in the medical sector.
- Corporate Finance Departments: Evaluate valuation scenarios to inform strategic decisions within healthcare organizations.
- Consultants and Advisors: Deliver precise valuation insights for Shanghai Runda Medical Technology Co., Ltd. (603108SS) to clients.
- Students and Educators: Utilize real-world data for hands-on practice and teaching in financial modeling for healthcare companies.
- Medical Technology Enthusiasts: Gain insights into how medical technology firms like Shanghai Runda are valued in the marketplace.
Contents of the Template
- Preloaded SHR Data: Historical and projected financial metrics, including revenue, EBIT, and capital expenditures for Shanghai Runda Medical Technology Co., Ltd. (603108SS).
- DCF and WACC Models: Advanced spreadsheets designed for calculating intrinsic value and the Weighted Average Cost of Capital.
- Editable Inputs: Yellow-highlighted cells that allow customization of revenue growth, tax rates, and discount rates.
- Financial Statements: Detailed annual and quarterly financial reports for in-depth analysis.
- Key Ratios: Metrics for profitability, leverage, and efficiency to assess overall performance.
- Dashboard and Charts: Visual representations of valuation outcomes and underlying assumptions.
Disclaimer
All information, articles, and product details provided on this website are for general informational and educational purposes only. We do not claim any ownership over, nor do we intend to infringe upon, any trademarks, copyrights, logos, brand names, or other intellectual property mentioned or depicted on this site. Such intellectual property remains the property of its respective owners, and any references here are made solely for identification or informational purposes, without implying any affiliation, endorsement, or partnership.
We make no representations or warranties, express or implied, regarding the accuracy, completeness, or suitability of any content or products presented. Nothing on this website should be construed as legal, tax, investment, financial, medical, or other professional advice. In addition, no part of this site—including articles or product references—constitutes a solicitation, recommendation, endorsement, advertisement, or offer to buy or sell any securities, franchises, or other financial instruments, particularly in jurisdictions where such activity would be unlawful.
All content is of a general nature and may not address the specific circumstances of any individual or entity. It is not a substitute for professional advice or services. Any actions you take based on the information provided here are strictly at your own risk. You accept full responsibility for any decisions or outcomes arising from your use of this website and agree to release us from any liability in connection with your use of, or reliance upon, the content or products found herein.