
|
Nanjing kangni mecánico & Electrical Co., Ltd (603111.ss) Valoración de DCF |
Completamente Editable: Adáptelo A Sus Necesidades En Excel O Sheets
Diseño Profesional: Plantillas Confiables Y Estándares De La Industria
Predeterminadas Para Un Uso Rápido Y Eficiente
Compatible con MAC / PC, completamente desbloqueado
No Se Necesita Experiencia; Fáciles De Seguir
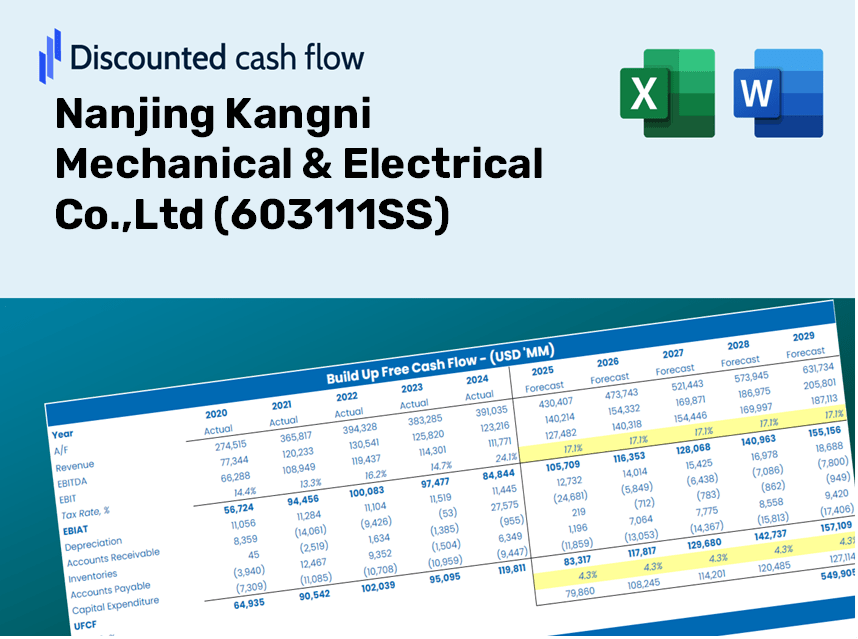
Nanjing Kangni Mechanical & Electrical Co.,Ltd (603111.SS) Bundle
Evaluar nanjing kangni mecánico & ¡Electrical Co., Perspectivas financieras de LTD con experiencia! Esta calculadora DCF (603111SS) le proporciona datos financieros prejuguados y la flexibilidad completa para modificar el crecimiento de los ingresos, WACC, los márgenes y otros supuestos esenciales para que coincidan con sus proyecciones.
Discounted Cash Flow (DCF) - (USD MM)
| Year | AY1 2020 |
AY2 2021 |
AY3 2022 |
AY4 2023 |
AY5 2024 |
FY1 2025 |
FY2 2026 |
FY3 2027 |
FY4 2028 |
FY5 2029 |
|---|---|---|---|---|---|---|---|---|---|---|
| Revenue | 3,325.7 | 3,525.2 | 3,294.9 | 3,522.4 | 3,967.7 | 4,156.3 | 4,353.9 | 4,560.8 | 4,777.6 | 5,004.7 |
| Revenue Growth, % | 0 | 6 | -6.53 | 6.9 | 12.64 | 4.75 | 4.75 | 4.75 | 4.75 | 4.75 |
| EBITDA | 547.5 | 532.7 | 407.6 | 505.4 | 470.0 | 583.0 | 610.7 | 639.8 | 670.2 | 702.0 |
| EBITDA, % | 16.46 | 15.11 | 12.37 | 14.35 | 11.85 | 14.03 | 14.03 | 14.03 | 14.03 | 14.03 |
| Depreciation | 84.1 | 103.8 | 102.5 | 96.0 | 79.1 | 110.6 | 115.8 | 121.3 | 127.1 | 133.1 |
| Depreciation, % | 2.53 | 2.95 | 3.11 | 2.72 | 1.99 | 2.66 | 2.66 | 2.66 | 2.66 | 2.66 |
| EBIT | 463.4 | 428.9 | 305.1 | 409.4 | 390.9 | 472.5 | 494.9 | 518.4 | 543.1 | 568.9 |
| EBIT, % | 13.93 | 12.17 | 9.26 | 11.62 | 9.85 | 11.37 | 11.37 | 11.37 | 11.37 | 11.37 |
| Total Cash | 2,088.1 | 2,377.1 | 2,099.8 | 2,063.2 | 2,132.9 | 2,546.0 | 2,667.0 | 2,793.7 | 2,926.5 | 3,065.6 |
| Total Cash, percent | .0 | .0 | .0 | .0 | .0 | .0 | .0 | .0 | .0 | .0 |
| Account Receivables | 1,984.7 | 2,193.2 | 2,625.6 | 2,986.8 | 3,346.3 | 3,081.6 | 3,228.1 | 3,381.5 | 3,542.2 | 3,710.6 |
| Account Receivables, % | 59.68 | 62.21 | 79.69 | 84.8 | 84.34 | 74.14 | 74.14 | 74.14 | 74.14 | 74.14 |
| Inventories | 641.5 | 562.7 | 583.6 | 596.2 | 704.0 | 728.5 | 763.1 | 799.4 | 837.4 | 877.2 |
| Inventories, % | 19.29 | 15.96 | 17.71 | 16.93 | 17.74 | 17.53 | 17.53 | 17.53 | 17.53 | 17.53 |
| Accounts Payable | 1,433.0 | 1,465.9 | 1,511.6 | 944.8 | 1,704.1 | 1,665.2 | 1,744.3 | 1,827.2 | 1,914.1 | 2,005.1 |
| Accounts Payable, % | 43.09 | 41.58 | 45.88 | 26.82 | 42.95 | 40.06 | 40.06 | 40.06 | 40.06 | 40.06 |
| Capital Expenditure | -79.5 | -80.9 | -91.0 | -127.3 | -116.7 | -116.4 | -121.9 | -127.7 | -133.8 | -140.1 |
| Capital Expenditure, % | -2.39 | -2.29 | -2.76 | -3.61 | -2.94 | -2.8 | -2.8 | -2.8 | -2.8 | -2.8 |
| Tax Rate, % | 9 | 9 | 9 | 9 | 9 | 9 | 9 | 9 | 9 | 9 |
| EBITAT | 418.5 | 390.2 | 260.9 | 357.5 | 355.7 | 420.6 | 440.6 | 461.5 | 483.4 | 506.4 |
| Depreciation | ||||||||||
| Changes in Account Receivables | ||||||||||
| Changes in Inventories | ||||||||||
| Changes in Accounts Payable | ||||||||||
| Capital Expenditure | ||||||||||
| UFCF | -770.1 | 316.3 | -135.2 | -614.5 | 610.2 | 616.1 | 332.5 | 348.4 | 364.9 | 382.3 |
| WACC, % | 5.04 | 5.04 | 5.03 | 5.03 | 5.04 | 5.03 | 5.03 | 5.03 | 5.03 | 5.03 |
| PV UFCF | ||||||||||
| SUM PV UFCF | 1,787.4 | |||||||||
| Long Term Growth Rate, % | 2.00 | |||||||||
| Free cash flow (T + 1) | 390 | |||||||||
| Terminal Value | 12,849 | |||||||||
| Present Terminal Value | 10,051 | |||||||||
| Enterprise Value | 11,838 | |||||||||
| Net Debt | -970 | |||||||||
| Equity Value | 12,809 | |||||||||
| Diluted Shares Outstanding, MM | 894 | |||||||||
| Equity Value Per Share | 14.33 |
What You Will Receive
- Authentic Nanjing Kangni Data: Comprehensive financials – encompassing revenue to EBIT – derived from real and anticipated figures.
- Complete Customization: Modify all essential parameters (yellow cells) such as WACC, growth %, and tax rates.
- Immediate Valuation Adjustments: Automatic recalibrations to assess the effects of changes on Nanjing Kangni’s fair value.
- Flexible Excel Template: Designed for efficient modifications, scenario analysis, and in-depth forecasts.
- Efficient and Precise: Eliminate the need to create models from the ground up while ensuring accuracy and adaptability.
Key Features
- Authentic Financial Data: Gain access to reliable pre-loaded historical metrics and forward-looking projections for Nanjing Kangni Mechanical & Electrical Co., Ltd (603111SS).
- Customizable Forecast Parameters: Adjust the highlighted cells for WACC, growth rates, and profit margins to fit your analysis.
- Real-Time Calculations: Enjoy automatic updates for DCF, Net Present Value (NPV), and cash flow assessments.
- User-Friendly Dashboard: Intuitive charts and summaries that simplify the visualization of your valuation findings.
- Designed for All Skill Levels: A straightforward structure tailored for investors, CFOs, and consultants alike.
How It Works
- Step 1: Download the Excel file.
- Step 2: Review the pre-filled data on Nanjing Kangni Mechanical & Electrical Co., Ltd (603111SS) (symbol: [603111SS]), including historical and projected figures.
- Step 3: Modify key assumptions (highlighted in yellow) based on your analysis.
- Step 4: Observe the automatic recalculations for the intrinsic value of Nanjing Kangni Mechanical & Electrical Co., Ltd (603111SS) (symbol: [603111SS]).
- Step 5: Utilize the results for your investment decisions or reporting purposes.
Why Opt for This Calculator?
- Precision: Utilizes authentic financial data from Nanjing Kangni Mechanical & Electrical Co., Ltd (603111SS) to ensure accuracy.
- Versatility: Crafted to allow users to experiment and adjust variables effortlessly.
- Efficiency: Eliminate the complexities of constructing a DCF model independently.
- Expert-Level Quality: Developed with the precision and functionality expected at the CFO level.
- Intuitive Interface: Simple to navigate, even for users without extensive financial modeling skills.
Who Can Benefit from This Product?
- Engineering Students: Discover essential mechanical and electrical principles and apply them to real-world scenarios.
- Researchers: Integrate advanced industry models into your studies or innovative projects.
- Investors: Evaluate your investment strategies and analyze the market performance of Nanjing Kangni Mechanical & Electrical Co.,Ltd (603111SS).
- Industry Analysts: Enhance your analysis with a customizable financial model tailored for mechanical and electrical sectors.
- Entrepreneurs: Learn how established firms like Nanjing Kangni Mechanical & Electrical Co.,Ltd (603111SS) navigate the market landscape.
Overview of the Template Features
- Detailed DCF Model: An editable template designed for in-depth valuation calculations.
- Current Financial Insights: Nanjing Kangni Mechanical & Electrical Co., Ltd's (603111SS) historical and projected financial data preloaded for examination.
- Adjustable Inputs: Modify WACC, growth rates, and tax assumptions to evaluate different scenarios.
- Comprehensive Financial Statements: Complete annual and quarterly statements for enhanced analysis.
- Essential Ratios: Integrated assessment of profitability, efficiency, and leverage metrics.
- Interactive Dashboard with Visuals: Graphs and tables presenting clear, actionable insights.
Disclaimer
All information, articles, and product details provided on this website are for general informational and educational purposes only. We do not claim any ownership over, nor do we intend to infringe upon, any trademarks, copyrights, logos, brand names, or other intellectual property mentioned or depicted on this site. Such intellectual property remains the property of its respective owners, and any references here are made solely for identification or informational purposes, without implying any affiliation, endorsement, or partnership.
We make no representations or warranties, express or implied, regarding the accuracy, completeness, or suitability of any content or products presented. Nothing on this website should be construed as legal, tax, investment, financial, medical, or other professional advice. In addition, no part of this site—including articles or product references—constitutes a solicitation, recommendation, endorsement, advertisement, or offer to buy or sell any securities, franchises, or other financial instruments, particularly in jurisdictions where such activity would be unlawful.
All content is of a general nature and may not address the specific circumstances of any individual or entity. It is not a substitute for professional advice or services. Any actions you take based on the information provided here are strictly at your own risk. You accept full responsibility for any decisions or outcomes arising from your use of this website and agree to release us from any liability in connection with your use of, or reliance upon, the content or products found herein.