
|
Ningbo Fujia Industrial Co., Ltd. (603219.ss) Valoración de DCF |
Completamente Editable: Adáptelo A Sus Necesidades En Excel O Sheets
Diseño Profesional: Plantillas Confiables Y Estándares De La Industria
Predeterminadas Para Un Uso Rápido Y Eficiente
Compatible con MAC / PC, completamente desbloqueado
No Se Necesita Experiencia; Fáciles De Seguir
Ningbo Fujia Industrial Co., Ltd. (603219.SS) Bundle
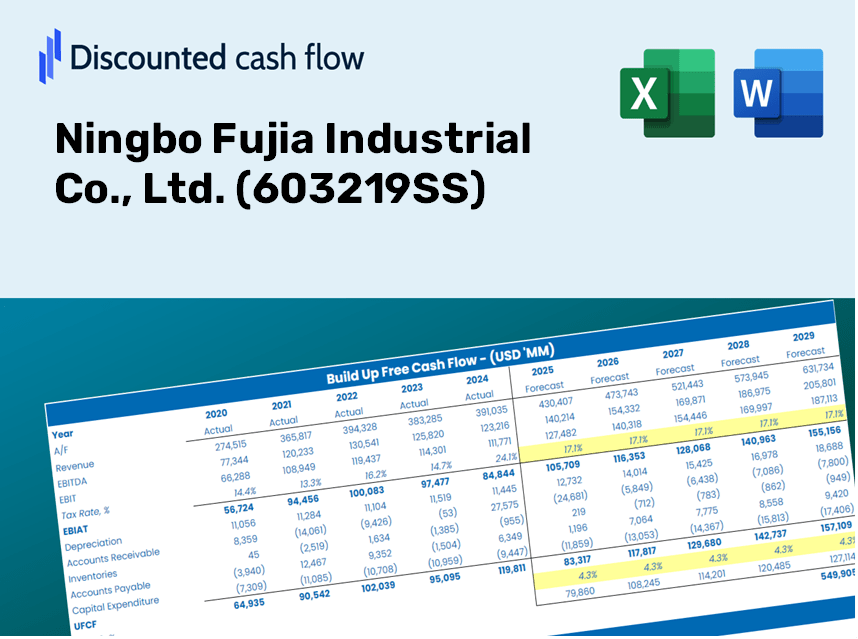
¡Mejore sus estrategias de inversión con la calculadora DCF (603219SS)! Explore datos financieros reales para Ningbo Fujia Industrial Co., Ltd., ajuste las proyecciones y gastos de crecimiento, y observe los efectos inmediatos sobre el valor intrínseco de (603219SS).
Discounted Cash Flow (DCF) - (USD MM)
| Year | AY1 2020 |
AY2 2021 |
AY3 2022 |
AY4 2023 |
AY5 2024 |
FY1 2025 |
FY2 2026 |
FY3 2027 |
FY4 2028 |
FY5 2029 |
|---|---|---|---|---|---|---|---|---|---|---|
| Revenue | 2,094.8 | 2,600.5 | 2,744.4 | 2,693.0 | 2,702.0 | 2,892.0 | 3,095.5 | 3,313.2 | 3,546.2 | 3,795.6 |
| Revenue Growth, % | 0 | 24.14 | 5.53 | -1.87 | 0.33546 | 7.03 | 7.03 | 7.03 | 7.03 | 7.03 |
| EBITDA | 261.2 | 254.0 | 367.9 | 321.3 | 216.8 | 321.6 | 344.2 | 368.4 | 394.3 | 422.1 |
| EBITDA, % | 12.47 | 9.77 | 13.41 | 11.93 | 8.02 | 11.12 | 11.12 | 11.12 | 11.12 | 11.12 |
| Depreciation | 27.8 | 34.4 | 41.1 | 46.2 | 55.0 | 45.7 | 48.9 | 52.3 | 56.0 | 60.0 |
| Depreciation, % | 1.33 | 1.32 | 1.5 | 1.72 | 2.03 | 1.58 | 1.58 | 1.58 | 1.58 | 1.58 |
| EBIT | 233.4 | 219.7 | 326.8 | 275.1 | 161.8 | 275.9 | 295.3 | 316.1 | 338.3 | 362.1 |
| EBIT, % | 11.14 | 8.45 | 11.91 | 10.21 | 5.99 | 9.54 | 9.54 | 9.54 | 9.54 | 9.54 |
| Total Cash | 480.6 | 502.3 | 794.6 | 796.8 | 647.7 | 721.7 | 772.5 | 826.8 | 884.9 | 947.2 |
| Total Cash, percent | .0 | .0 | .0 | .0 | .0 | .0 | .0 | .0 | .0 | .0 |
| Account Receivables | 456.1 | 714.2 | 564.3 | 791.9 | 687.7 | 721.0 | 771.7 | 826.0 | 884.1 | 946.3 |
| Account Receivables, % | 21.77 | 27.46 | 20.56 | 29.4 | 25.45 | 24.93 | 24.93 | 24.93 | 24.93 | 24.93 |
| Inventories | 343.3 | 479.5 | 335.9 | 291.1 | 442.0 | 429.4 | 459.6 | 491.9 | 526.5 | 563.5 |
| Inventories, % | 16.39 | 18.44 | 12.24 | 10.81 | 16.36 | 14.85 | 14.85 | 14.85 | 14.85 | 14.85 |
| Accounts Payable | 629.4 | 690.8 | 558.1 | 859.2 | 973.5 | 838.0 | 896.9 | 960.0 | 1,027.5 | 1,099.8 |
| Accounts Payable, % | 30.05 | 26.56 | 20.34 | 31.9 | 36.03 | 28.98 | 28.98 | 28.98 | 28.98 | 28.98 |
| Capital Expenditure | -76.6 | -168.0 | -90.6 | -135.0 | -252.8 | -160.8 | -172.1 | -184.2 | -197.1 | -211.0 |
| Capital Expenditure, % | -3.66 | -6.46 | -3.3 | -5.01 | -9.36 | -5.56 | -5.56 | -5.56 | -5.56 | -5.56 |
| Tax Rate, % | 6.1 | 6.1 | 6.1 | 6.1 | 6.1 | 6.1 | 6.1 | 6.1 | 6.1 | 6.1 |
| EBITAT | 203.0 | 190.9 | 285.8 | 235.4 | 152.0 | 243.3 | 260.4 | 278.7 | 298.3 | 319.2 |
| Depreciation | ||||||||||
| Changes in Account Receivables | ||||||||||
| Changes in Inventories | ||||||||||
| Changes in Accounts Payable | ||||||||||
| Capital Expenditure | ||||||||||
| UFCF | -15.7 | -275.7 | 397.1 | 264.9 | 21.6 | -27.9 | 115.2 | 123.3 | 132.0 | 141.3 |
| WACC, % | 4.66 | 4.66 | 4.66 | 4.66 | 4.67 | 4.67 | 4.67 | 4.67 | 4.67 | 4.67 |
| PV UFCF | ||||||||||
| SUM PV UFCF | 408.6 | |||||||||
| Long Term Growth Rate, % | 2.00 | |||||||||
| Free cash flow (T + 1) | 144 | |||||||||
| Terminal Value | 5,408 | |||||||||
| Present Terminal Value | 4,305 | |||||||||
| Enterprise Value | 4,714 | |||||||||
| Net Debt | -559 | |||||||||
| Equity Value | 5,273 | |||||||||
| Diluted Shares Outstanding, MM | 567 | |||||||||
| Equity Value Per Share | 9.31 |
What You Will Receive
- Comprehensive Financial Model: Leverage Ningbo Fujia Industrial Co., Ltd.'s (603219SS) actual data for accurate DCF valuation.
- Complete Forecast Flexibility: Modify key parameters such as revenue growth, profit margins, WACC, and more.
- Real-Time Calculations: Instantly see results as changes are made with automatic updates.
- Professional-Grade Template: An expertly crafted Excel file designed for high-quality valuation.
- Customizable for Ongoing Use: Built for adaptability, allowing repeated application for in-depth forecasting.
Core Highlights
- Authentic Financial Data: Gain access to reliable pre-loaded historical figures and future forecasts for Ningbo Fujia Industrial Co., Ltd. (603219SS).
- Adjustable Forecast Parameters: Modify highlighted cells to customize key metrics such as WACC, growth rates, and margins.
- Responsive Calculations: Enjoy automatic updates for DCF, Net Present Value (NPV), and cash flow evaluations.
- Interactive Dashboard: User-friendly charts and summaries that effectively present your valuation outcomes.
- Designed for All Users: A straightforward and intuitive layout catered to investors, CFOs, and consultants alike.
How It Functions
- 1. Access the Template: Download and open the Excel file containing Ningbo Fujia Industrial Co., Ltd.'s (603219SS) preloaded data.
- 2. Update Assumptions: Modify critical inputs such as growth rates, WACC, and capital expenditures.
- 3. See Results in Real-Time: The DCF model automatically computes intrinsic value and NPV.
- 4. Explore Scenarios: Analyze various forecasts to evaluate different valuation results.
- 5. Present with Assurance: Deliver professional valuation insights to bolster your decision-making process.
Why Choose Ningbo Fujia Industrial Co., Ltd. (603219SS)?
- Reliable Insights: Utilize authentic financial data for trustworthy valuation assessments.
- Flexible Options: Modify essential parameters such as growth forecasts, WACC, and tax rates to align with your expectations.
- Efficiency Boost: Ready-to-use calculations save you the hassle of starting from scratch.
- Expert-Level Resource: Tailored for investors, financial analysts, and industry consultants.
- Easy to Use: Streamlined design and comprehensive guidance ensure accessibility for all users.
Who Can Benefit from This Product?
- Investors: Accurately assess the fair value of Ningbo Fujia Industrial Co., Ltd. (603219SS) before making investment choices.
- Chief Financial Officers (CFOs): Utilize a professional-grade DCF model for enhanced financial reporting and analysis.
- Consultants: Easily customize the template for valuation reports tailored to client needs.
- Entrepreneurs: Acquire knowledge about financial modeling techniques employed by leading companies.
- Educators: Implement it as a teaching resource to illustrate various valuation methodologies.
Contents of the Template
- Pre-Filled Data: Contains Ningbo Fujia Industrial Co., Ltd.'s historical performance and projections.
- Discounted Cash Flow Model: An editable DCF model featuring automatic calculations.
- Weighted Average Cost of Capital (WACC): A specialized section for calculating WACC with user-defined inputs.
- Key Financial Ratios: Evaluate Ningbo Fujia's profitability, efficiency, and financial leverage.
- Customizable Inputs: Easily adjust revenue growth, profit margins, and tax rates.
- Clear Dashboard: Visualizations and tables summarizing essential valuation outcomes.
Disclaimer
All information, articles, and product details provided on this website are for general informational and educational purposes only. We do not claim any ownership over, nor do we intend to infringe upon, any trademarks, copyrights, logos, brand names, or other intellectual property mentioned or depicted on this site. Such intellectual property remains the property of its respective owners, and any references here are made solely for identification or informational purposes, without implying any affiliation, endorsement, or partnership.
We make no representations or warranties, express or implied, regarding the accuracy, completeness, or suitability of any content or products presented. Nothing on this website should be construed as legal, tax, investment, financial, medical, or other professional advice. In addition, no part of this site—including articles or product references—constitutes a solicitation, recommendation, endorsement, advertisement, or offer to buy or sell any securities, franchises, or other financial instruments, particularly in jurisdictions where such activity would be unlawful.
All content is of a general nature and may not address the specific circumstances of any individual or entity. It is not a substitute for professional advice or services. Any actions you take based on the information provided here are strictly at your own risk. You accept full responsibility for any decisions or outcomes arising from your use of this website and agree to release us from any liability in connection with your use of, or reliance upon, the content or products found herein.