
|
Dashenlin Pharmaceutical Group Co., Ltd. (603233.ss) Valoración de DCF |
Completamente Editable: Adáptelo A Sus Necesidades En Excel O Sheets
Diseño Profesional: Plantillas Confiables Y Estándares De La Industria
Predeterminadas Para Un Uso Rápido Y Eficiente
Compatible con MAC / PC, completamente desbloqueado
No Se Necesita Experiencia; Fáciles De Seguir
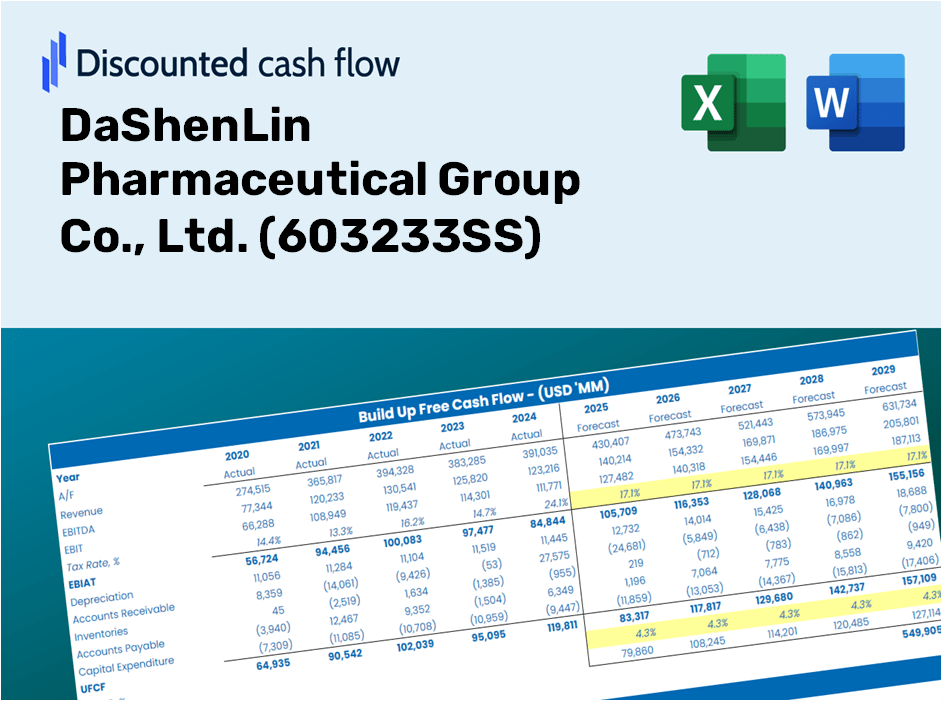
DaShenLin Pharmaceutical Group Co., Ltd. (603233.SS) Bundle
¡Descubra el verdadero potencial de Dashenlin Pharmaceutical Group Co., Ltd. (603233SS) con nuestra calculadora DCF avanzada! Ajuste los supuestos clave, explore varios escenarios y evalúe cómo los diferentes cambios afectan la valoración de Dashenlin Pharmaceutical Group Co., Ltd. (603233SS), todo dentro de una plantilla de Excel fácil de usar.
Discounted Cash Flow (DCF) - (USD MM)
| Year | AY1 2020 |
AY2 2021 |
AY3 2022 |
AY4 2023 |
AY5 2024 |
FY1 2025 |
FY2 2026 |
FY3 2027 |
FY4 2028 |
FY5 2029 |
|---|---|---|---|---|---|---|---|---|---|---|
| Revenue | 14,582.9 | 16,759.3 | 21,248.1 | 24,531.4 | 26,496.5 | 26,849.5 | 27,207.2 | 27,569.7 | 27,937.0 | 28,309.2 |
| Revenue Growth, % | 0 | 14.92 | 26.78 | 15.45 | 8.01 | 1.33 | 1.33 | 1.33 | 1.33 | 1.33 |
| EBITDA | 1,533.3 | 1,305.9 | 1,808.2 | 3,244.1 | 3,131.0 | 2,784.7 | 2,821.8 | 2,859.4 | 2,897.5 | 2,936.1 |
| EBITDA, % | 10.51 | 7.79 | 8.51 | 13.22 | 11.82 | 10.37 | 10.37 | 10.37 | 10.37 | 10.37 |
| Depreciation | 170.8 | 204.6 | 218.1 | 1,447.6 | 1,583.5 | 821.4 | 832.3 | 843.4 | 854.6 | 866.0 |
| Depreciation, % | 1.17 | 1.22 | 1.03 | 5.9 | 5.98 | 3.06 | 3.06 | 3.06 | 3.06 | 3.06 |
| EBIT | 1,362.6 | 1,101.3 | 1,590.1 | 1,796.5 | 1,547.5 | 1,963.3 | 1,989.5 | 2,016.0 | 2,042.8 | 2,070.1 |
| EBIT, % | 9.34 | 6.57 | 7.48 | 7.32 | 5.84 | 7.31 | 7.31 | 7.31 | 7.31 | 7.31 |
| Total Cash | 4,440.3 | 2,901.7 | 4,585.0 | 4,458.3 | 6,232.3 | 5,962.6 | 6,042.0 | 6,122.5 | 6,204.1 | 6,286.7 |
| Total Cash, percent | .0 | .0 | .0 | .0 | .0 | .0 | .0 | .0 | .0 | .0 |
| Account Receivables | 659.3 | 743.8 | 1,390.0 | 1,670.5 | 1,703.3 | 1,543.3 | 1,563.8 | 1,584.7 | 1,605.8 | 1,627.2 |
| Account Receivables, % | 4.52 | 4.44 | 6.54 | 6.81 | 6.43 | 5.75 | 5.75 | 5.75 | 5.75 | 5.75 |
| Inventories | 2,682.5 | 3,630.1 | 3,872.5 | 4,181.2 | 4,128.0 | 4,881.5 | 4,946.5 | 5,012.4 | 5,079.2 | 5,146.9 |
| Inventories, % | 18.4 | 21.66 | 18.22 | 17.04 | 15.58 | 18.18 | 18.18 | 18.18 | 18.18 | 18.18 |
| Accounts Payable | 4,214.8 | 4,737.8 | 6,127.4 | 6,870.5 | 8,433.0 | 7,831.7 | 7,936.0 | 8,041.7 | 8,148.9 | 8,257.4 |
| Accounts Payable, % | 28.9 | 28.27 | 28.84 | 28.01 | 31.83 | 29.17 | 29.17 | 29.17 | 29.17 | 29.17 |
| Capital Expenditure | -792.3 | -1,294.9 | -1,034.8 | -1,796.6 | -1,475.8 | -1,660.6 | -1,682.7 | -1,705.1 | -1,727.8 | -1,750.8 |
| Capital Expenditure, % | -5.43 | -7.73 | -4.87 | -7.32 | -5.57 | -6.18 | -6.18 | -6.18 | -6.18 | -6.18 |
| Tax Rate, % | 31.72 | 31.72 | 31.72 | 31.72 | 31.72 | 31.72 | 31.72 | 31.72 | 31.72 | 31.72 |
| EBITAT | 1,000.6 | 834.7 | 1,164.0 | 1,287.4 | 1,056.7 | 1,422.9 | 1,441.9 | 1,461.1 | 1,480.6 | 1,500.3 |
| Depreciation | ||||||||||
| Changes in Account Receivables | ||||||||||
| Changes in Inventories | ||||||||||
| Changes in Accounts Payable | ||||||||||
| Capital Expenditure | ||||||||||
| UFCF | 1,252.1 | -764.8 | 848.3 | 1,092.2 | 2,747.3 | -611.1 | 610.2 | 618.4 | 626.6 | 635.0 |
| WACC, % | 5.24 | 5.26 | 5.24 | 5.22 | 5.18 | 5.23 | 5.23 | 5.23 | 5.23 | 5.23 |
| PV UFCF | ||||||||||
| SUM PV UFCF | 1,504.3 | |||||||||
| Long Term Growth Rate, % | 3.50 | |||||||||
| Free cash flow (T + 1) | 657 | |||||||||
| Terminal Value | 38,025 | |||||||||
| Present Terminal Value | 29,471 | |||||||||
| Enterprise Value | 30,976 | |||||||||
| Net Debt | 104 | |||||||||
| Equity Value | 30,872 | |||||||||
| Diluted Shares Outstanding, MM | 1,129 | |||||||||
| Equity Value Per Share | 27.34 |
What You Will Receive
- Comprehensive Financial Model: Leverage DaShenLin’s actual data for accurate DCF valuation.
- Complete Forecasting Flexibility: Modify revenue growth, profit margins, WACC, and other essential variables.
- Real-Time Calculations: Instantaneous updates provide immediate results as you make adjustments.
- Professional-Grade Template: A polished Excel file tailored for high-quality valuation presentations.
- Adaptable and Reusable: Designed for versatility, this template allows for repeated use in detailed projections.
Key Features
- Authentic Financial Data: Access reliable pre-loaded historical information and future forecasts specific to DaShenLin Pharmaceutical Group Co., Ltd. (603233SS).
- Customizable Projections: Modify key inputs highlighted in yellow, including WACC, growth rates, and profit margins.
- Real-Time Calculations: Automated updates for DCF, Net Present Value (NPV), and cash flow analyses.
- Interactive Dashboard: User-friendly charts and summaries to help visualize your valuation outcomes.
- Designed for All Skill Levels: An intuitive layout tailored for investors, CFOs, and consultants, whether they're seasoned professionals or newcomers.
How It Operates
- Download: Obtain the pre-configured Excel file featuring DaShenLin Pharmaceutical Group Co., Ltd.'s (603233SS) financial data.
- Customize: Modify your projections, including revenue growth, EBITDA margin, and WACC.
- Update Automatically: Watch as intrinsic value and NPV calculations refresh in real-time.
- Test Scenarios: Develop various projections and instantly assess the results.
- Make Decisions: Leverage the valuation insights to inform your investment approach.
Why Choose This Calculator?
- Designed for Experts: A specialized tool favored by analysts, CFOs, and industry consultants.
- Accurate Financial Data: Preloaded historical and projected financial information for DaShenLin Pharmaceutical Group Co., Ltd. (603233SS).
- Flexible Scenario Analysis: Effortlessly explore various forecasts and assumptions.
- Insightful Outputs: Instantly calculates intrinsic value, NPV, and essential metrics.
- User-Friendly: Comprehensive step-by-step guidance for a seamless experience.
Who Can Benefit from This Product?
- Investors: Evaluate DaShenLin Pharmaceutical Group Co., Ltd. (603233SS) before making investment decisions.
- CFOs and Financial Analysts: Enhance valuation methodologies and validate financial forecasts.
- Startup Founders: Gain insights into the valuation of leading pharmaceutical companies like DaShenLin.
- Consultants: Generate comprehensive valuation reports for clients in the pharmaceutical sector.
- Students and Educators: Utilize current market data to learn and teach valuation practices.
Contents of the Template
- Pre-Filled Data: Contains DaShenLin Pharmaceutical Group Co., Ltd.’s historical financials and projections.
- Discounted Cash Flow Model: An editable DCF valuation model with automated calculations.
- Weighted Average Cost of Capital (WACC): A specific sheet for calculating WACC using tailored inputs.
- Key Financial Ratios: Assess DaShenLin’s profitability, efficiency, and leverage metrics.
- Customizable Inputs: Easily adjust revenue growth, profit margins, and tax rates.
- Clear Dashboard: Visual representations including charts and tables that summarize critical valuation results.
Disclaimer
All information, articles, and product details provided on this website are for general informational and educational purposes only. We do not claim any ownership over, nor do we intend to infringe upon, any trademarks, copyrights, logos, brand names, or other intellectual property mentioned or depicted on this site. Such intellectual property remains the property of its respective owners, and any references here are made solely for identification or informational purposes, without implying any affiliation, endorsement, or partnership.
We make no representations or warranties, express or implied, regarding the accuracy, completeness, or suitability of any content or products presented. Nothing on this website should be construed as legal, tax, investment, financial, medical, or other professional advice. In addition, no part of this site—including articles or product references—constitutes a solicitation, recommendation, endorsement, advertisement, or offer to buy or sell any securities, franchises, or other financial instruments, particularly in jurisdictions where such activity would be unlawful.
All content is of a general nature and may not address the specific circumstances of any individual or entity. It is not a substitute for professional advice or services. Any actions you take based on the information provided here are strictly at your own risk. You accept full responsibility for any decisions or outcomes arising from your use of this website and agree to release us from any liability in connection with your use of, or reliance upon, the content or products found herein.