
|
Ningbo Xusheng Auto Technology Co., Ltd. (603305.ss) Valoración de DCF |
Completamente Editable: Adáptelo A Sus Necesidades En Excel O Sheets
Diseño Profesional: Plantillas Confiables Y Estándares De La Industria
Predeterminadas Para Un Uso Rápido Y Eficiente
Compatible con MAC / PC, completamente desbloqueado
No Se Necesita Experiencia; Fáciles De Seguir
Ningbo Xusheng Auto Technology Co., Ltd. (603305.SS) Bundle
¿Busca evaluar el valor intrínseco de Ningbo Xusheng Auto Technology Co., Ltd.? Nuestra calculadora DCF (603305SS) integra datos del mundo real con extensas funciones de personalización, lo que le permite refinar sus pronósticos y mejorar sus decisiones de inversión.
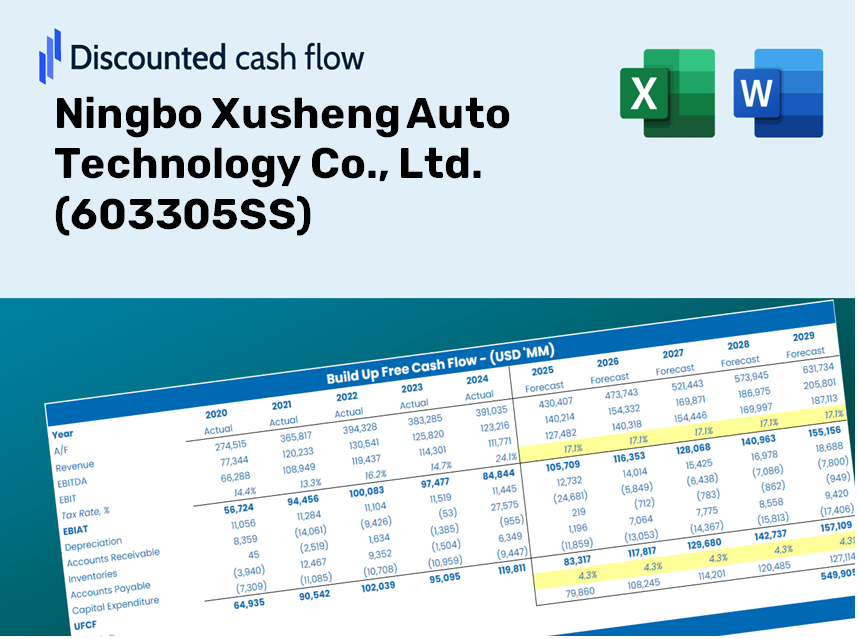
Discounted Cash Flow (DCF) - (USD MM)
| Year | AY1 2020 |
AY2 2021 |
AY3 2022 |
AY4 2023 |
AY5 2024 |
FY1 2025 |
FY2 2026 |
FY3 2027 |
FY4 2028 |
FY5 2029 |
|---|---|---|---|---|---|---|---|---|---|---|
| Revenue | 1,627.5 | 3,023.4 | 4,453.7 | 4,833.9 | 4,408.8 | 5,872.7 | 7,822.6 | 10,420.1 | 13,880.1 | 18,488.9 |
| Revenue Growth, % | 0 | 85.77 | 47.31 | 8.54 | -8.79 | 33.2 | 33.2 | 33.2 | 33.2 | 33.2 |
| EBITDA | 473.5 | 579.0 | 952.5 | 1,107.6 | 914.0 | 1,330.4 | 1,772.2 | 2,360.6 | 3,144.5 | 4,188.6 |
| EBITDA, % | 29.09 | 19.15 | 21.39 | 22.91 | 20.73 | 22.65 | 22.65 | 22.65 | 22.65 | 22.65 |
| Depreciation | 102.0 | 123.8 | 222.0 | 362.3 | 448.3 | 387.7 | 516.4 | 687.9 | 916.3 | 1,220.6 |
| Depreciation, % | 6.27 | 4.09 | 4.98 | 7.49 | 10.17 | 6.6 | 6.6 | 6.6 | 6.6 | 6.6 |
| EBIT | 371.5 | 455.2 | 730.5 | 745.4 | 465.6 | 942.7 | 1,255.8 | 1,672.7 | 2,228.1 | 2,968.0 |
| EBIT, % | 22.82 | 15.06 | 16.4 | 15.42 | 10.56 | 16.05 | 16.05 | 16.05 | 16.05 | 16.05 |
| Total Cash | 1,456.6 | 2,602.1 | 2,388.2 | 2,064.9 | 4,127.2 | 4,293.2 | 5,718.7 | 7,617.5 | 10,146.9 | 13,516.1 |
| Total Cash, percent | .0 | .0 | .0 | .0 | .0 | .0 | .0 | .0 | .0 | .0 |
| Account Receivables | 466.0 | 1,020.9 | 1,270.6 | 1,353.4 | 1,253.5 | 1,730.8 | 2,305.5 | 3,071.0 | 4,090.7 | 5,449.0 |
| Account Receivables, % | 28.63 | 33.77 | 28.53 | 28 | 28.43 | 29.47 | 29.47 | 29.47 | 29.47 | 29.47 |
| Inventories | 434.5 | 920.4 | 1,344.3 | 1,063.1 | 1,081.3 | 1,572.0 | 2,094.0 | 2,789.3 | 3,715.5 | 4,949.2 |
| Inventories, % | 26.7 | 30.44 | 30.18 | 21.99 | 24.53 | 26.77 | 26.77 | 26.77 | 26.77 | 26.77 |
| Accounts Payable | 895.8 | 1,780.2 | 1,799.4 | 793.2 | 1,570.9 | 2,423.8 | 3,228.6 | 4,300.6 | 5,728.6 | 7,630.8 |
| Accounts Payable, % | 55.04 | 58.88 | 40.4 | 16.41 | 35.63 | 41.27 | 41.27 | 41.27 | 41.27 | 41.27 |
| Capital Expenditure | -542.1 | -1,446.4 | -1,261.6 | -1,320.9 | -567.5 | -1,757.9 | -2,341.7 | -3,119.2 | -4,154.9 | -5,534.5 |
| Capital Expenditure, % | -33.31 | -47.84 | -28.33 | -27.33 | -12.87 | -29.93 | -29.93 | -29.93 | -29.93 | -29.93 |
| Tax Rate, % | 11.55 | 11.55 | 11.55 | 11.55 | 11.55 | 11.55 | 11.55 | 11.55 | 11.55 | 11.55 |
| EBITAT | 319.4 | 404.4 | 654.7 | 649.0 | 411.9 | 829.5 | 1,105.0 | 1,471.8 | 1,960.6 | 2,611.6 |
| Depreciation | ||||||||||
| Changes in Account Receivables | ||||||||||
| Changes in Inventories | ||||||||||
| Changes in Accounts Payable | ||||||||||
| Capital Expenditure | ||||||||||
| UFCF | -125.4 | -1,074.7 | -1,039.3 | -1,117.5 | 1,152.1 | -655.9 | -1,012.2 | -1,348.2 | -1,795.9 | -2,392.2 |
| WACC, % | 8.54 | 8.56 | 8.57 | 8.55 | 8.56 | 8.55 | 8.55 | 8.55 | 8.55 | 8.55 |
| PV UFCF | ||||||||||
| SUM PV UFCF | -5,397.4 | |||||||||
| Long Term Growth Rate, % | 4.00 | |||||||||
| Free cash flow (T + 1) | -2,488 | |||||||||
| Terminal Value | -54,632 | |||||||||
| Present Terminal Value | -36,242 | |||||||||
| Enterprise Value | -41,640 | |||||||||
| Net Debt | 1,583 | |||||||||
| Equity Value | -43,223 | |||||||||
| Diluted Shares Outstanding, MM | 925 | |||||||||
| Equity Value Per Share | -46.73 |
What You Will Receive
- Customizable Forecast Inputs: Seamlessly adjust assumptions (growth %, margins, WACC) to explore various scenarios.
- Real-Time Data: Pre-filled financial data for Ningbo Xusheng Auto Technology Co., Ltd. (603305SS) to enhance your analysis.
- Automated DCF Calculations: The model provides you with Net Present Value (NPV) and intrinsic value outputs automatically.
- Professional and Adaptable: A sophisticated Excel template designed to meet your valuation requirements.
- Tailored for Analysts and Investors: Perfect for evaluating projections, confirming strategies, and optimizing efficiency.
Key Features
- Real-Life Xusheng Data: Pre-filled with Ningbo Xusheng Auto Technology's historical financials and future projections.
- Fully Customizable Inputs: Tailor revenue growth, profit margins, WACC, tax rates, and capital expenditures to your needs.
- Dynamic Valuation Model: Automatic recalculations of Net Present Value (NPV) and intrinsic value based on your adjustments.
- Scenario Testing: Develop various forecast scenarios to evaluate different valuation outcomes.
- User-Friendly Design: Intuitive, organized, and crafted for both industry experts and novices.
How It Functions
- Step 1: Download the Excel spreadsheet.
- Step 2: Examine the pre-filled data for Ningbo Xusheng Auto Technology Co., Ltd. (603305SS) (historical and projected).
- Step 3: Modify the key assumptions (yellow cells) according to your insights.
- Step 4: Observe the automatic recalculations reflecting the intrinsic value of Ningbo Xusheng Auto Technology Co., Ltd. (603305SS).
- Step 5: Utilize the results for investment analysis or reporting purposes.
Why Choose Our Solutions?
- All-in-One Solution: Combines advanced analytics, forecasts, and performance metrics tailored specifically for the automotive industry.
- Flexible Parameters: Modify highlighted fields to explore different market scenarios and outcomes.
- In-Depth Analysis: Automatically assesses Ningbo Xusheng’s intrinsic value and projected cash flows.
- Data-Rich Resources: Access to comprehensive historical and predictive data for reliable evaluations.
- Expert-Level Insights: Designed for automotive analysts, investors, and strategic consultants in the automotive sector.
Who Can Benefit from Ningbo Xusheng Auto Technology Co., Ltd. (603305SS)?
- Investors: Make informed investment choices with our advanced automotive technology insights.
- Market Analysts: Streamline your analysis with comprehensive data and market trends readily available for customization.
- Consultants: Efficiently modify our resources for client projects or strategic presentations.
- Automotive Enthusiasts: Expand your knowledge of the automotive sector through in-depth case studies and applications.
- Educators and Students: Utilize our materials as a valuable resource for automotive and technology-related academic courses.
Contents of the Template
- Preloaded Ningbo Xusheng Data: Historical and forecasted financial metrics, including revenue, EBIT, and capital expenditures.
- DCF and WACC Models: High-quality sheets designed for calculating intrinsic value and Weighted Average Cost of Capital.
- Editable Inputs: Yellow-highlighted cells for modifying revenue growth, tax rates, and discount rates.
- Financial Statements: Detailed annual and quarterly financial reports for in-depth analysis.
- Key Ratios: Metrics for profitability, leverage, and efficiency to assess performance.
- Dashboard and Charts: Visual representations of valuation results and underlying assumptions.
Disclaimer
All information, articles, and product details provided on this website are for general informational and educational purposes only. We do not claim any ownership over, nor do we intend to infringe upon, any trademarks, copyrights, logos, brand names, or other intellectual property mentioned or depicted on this site. Such intellectual property remains the property of its respective owners, and any references here are made solely for identification or informational purposes, without implying any affiliation, endorsement, or partnership.
We make no representations or warranties, express or implied, regarding the accuracy, completeness, or suitability of any content or products presented. Nothing on this website should be construed as legal, tax, investment, financial, medical, or other professional advice. In addition, no part of this site—including articles or product references—constitutes a solicitation, recommendation, endorsement, advertisement, or offer to buy or sell any securities, franchises, or other financial instruments, particularly in jurisdictions where such activity would be unlawful.
All content is of a general nature and may not address the specific circumstances of any individual or entity. It is not a substitute for professional advice or services. Any actions you take based on the information provided here are strictly at your own risk. You accept full responsibility for any decisions or outcomes arising from your use of this website and agree to release us from any liability in connection with your use of, or reliance upon, the content or products found herein.