
|
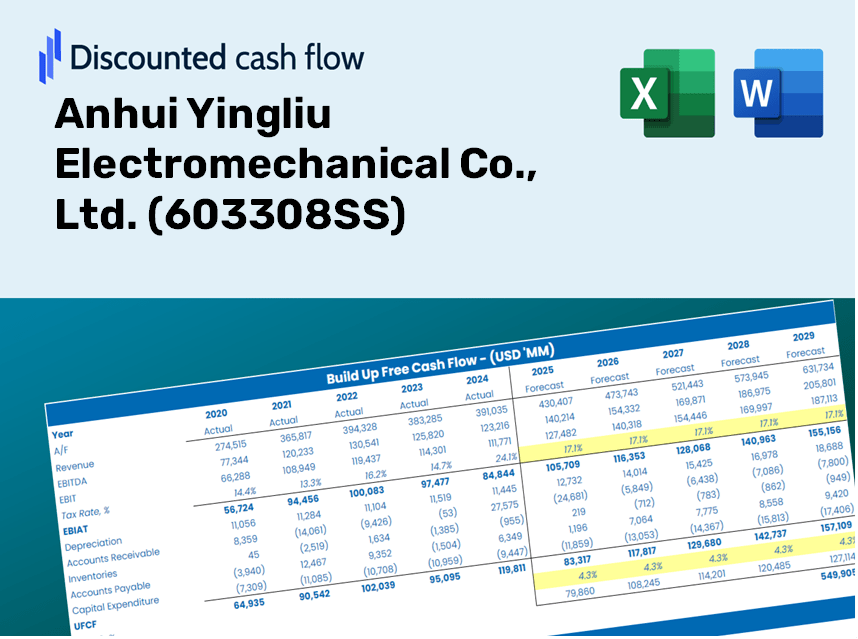
Anhui Yingliu Electromechanical Co., Ltd. (603308.SS) Valoración de DCF |
Completamente Editable: Adáptelo A Sus Necesidades En Excel O Sheets
Diseño Profesional: Plantillas Confiables Y Estándares De La Industria
Predeterminadas Para Un Uso Rápido Y Eficiente
Compatible con MAC / PC, completamente desbloqueado
No Se Necesita Experiencia; Fáciles De Seguir
Anhui Yingliu Electromechanical Co., Ltd. (603308.SS) Bundle
¡Evalúe la perspectiva financiera de Anhui Yingliu Electromechanical Co., Ltd. como un profesional! Esta calculadora DCF (603308SS) proporciona datos financieros previamente llenos junto con la flexibilidad para modificar el crecimiento de los ingresos, WACC, los márgenes y otros supuestos esenciales para alinearse con sus pronósticos.
Benefits You Will Receive
- Authentic AAPL Financial Data: Access to both historical and predictive data for precise valuation.
- Customizable Parameters: Adjust WACC, tax rates, revenue growth, and capital expenditures to suit your analysis.
- Real-Time Calculations: Instant calculations of intrinsic value and NPV as parameters change.
- Scenario Testing: Evaluate a variety of scenarios to assess the future performance of Anhui Yingliu Electromechanical Co., Ltd. (603308SS).
- User-Friendly Interface: Designed for professionals, yet simple enough for novices to navigate.
Key Features
- Customizable Forecast Inputs: Adjust essential parameters such as revenue growth, EBITDA margin, and capital expenditures for tailored projections.
- Instant DCF Valuation: Effortlessly computes intrinsic value, NPV, and other key metrics in real-time.
- High-Precision Accuracy: Leverages Anhui Yingliu Electromechanical's actual financial data for credible valuation results.
- Simplified Scenario Analysis: Easily evaluate various assumptions and analyze different outcomes.
- Efficiency Booster: Avoid the complexities of creating detailed valuation frameworks from the ground up.
How It Works
- Step 1: Download the ready-to-use Excel template that includes data for Anhui Yingliu Electromechanical Co., Ltd. (603308SS).
- Step 2: Review the pre-filled sheets to familiarize yourself with the essential metrics.
- Step 3: Modify forecasts and assumptions in the editable yellow cells (WACC, growth, margins).
- Step 4: Instantly see the recalculated results, including the intrinsic value of Anhui Yingliu Electromechanical Co., Ltd. (603308SS).
- Step 5: Use the outputs to make well-informed investment decisions or create detailed reports.
Why Choose This Calculator for Anhui Yingliu Electromechanical Co., Ltd. (603308SS)?
- User-Friendly Design: Tailored for both novices and experienced users.
- Customizable Inputs: Adjust variables effortlessly to suit your analysis needs.
- Real-Time Updates: Witness immediate alterations in Anhui Yingliu’s valuation as you modify inputs.
- Pre-Loaded Data: Comes with Anhui Yingliu’s actual financial figures for swift evaluations.
- Preferred by Experts: Utilized by investors and analysts for well-informed decision-making.
Who Can Benefit from This Product?
- Investors: Accurately assess Anhui Yingliu Electromechanical Co., Ltd.'s (603308SS) fair value prior to making investment choices.
- CFOs: Utilize a top-tier DCF model for comprehensive financial reporting and analysis.
- Consultants: Efficiently customize the template for client valuation reports.
- Entrepreneurs: Discover financial modeling techniques employed by leading companies in the industry.
- Educators: Employ it as a resource to illustrate various valuation methods in the classroom.
Contents of the Template
- Pre-Filled Data: Features Anhui Yingliu Electromechanical Co., Ltd.'s historical financials and projections.
- Discounted Cash Flow Model: An editable DCF valuation model with automated calculations.
- Weighted Average Cost of Capital (WACC): A dedicated worksheet for computing WACC based on user-defined inputs.
- Key Financial Ratios: Assess Anhui Yingliu's profitability, efficiency, and financial leverage.
- Customizable Inputs: Easily modify revenue growth, profit margins, and tax rates.
- User-Friendly Dashboard: Visual summaries including charts and tables highlighting key valuation outcomes.
Disclaimer
All information, articles, and product details provided on this website are for general informational and educational purposes only. We do not claim any ownership over, nor do we intend to infringe upon, any trademarks, copyrights, logos, brand names, or other intellectual property mentioned or depicted on this site. Such intellectual property remains the property of its respective owners, and any references here are made solely for identification or informational purposes, without implying any affiliation, endorsement, or partnership.
We make no representations or warranties, express or implied, regarding the accuracy, completeness, or suitability of any content or products presented. Nothing on this website should be construed as legal, tax, investment, financial, medical, or other professional advice. In addition, no part of this site—including articles or product references—constitutes a solicitation, recommendation, endorsement, advertisement, or offer to buy or sell any securities, franchises, or other financial instruments, particularly in jurisdictions where such activity would be unlawful.
All content is of a general nature and may not address the specific circumstances of any individual or entity. It is not a substitute for professional advice or services. Any actions you take based on the information provided here are strictly at your own risk. You accept full responsibility for any decisions or outcomes arising from your use of this website and agree to release us from any liability in connection with your use of, or reliance upon, the content or products found herein.