
|
Guangdong Ellington Electronics Technology Co., Ltd (603328.ss) Valoración de DCF |
Completamente Editable: Adáptelo A Sus Necesidades En Excel O Sheets
Diseño Profesional: Plantillas Confiables Y Estándares De La Industria
Predeterminadas Para Un Uso Rápido Y Eficiente
Compatible con MAC / PC, completamente desbloqueado
No Se Necesita Experiencia; Fáciles De Seguir
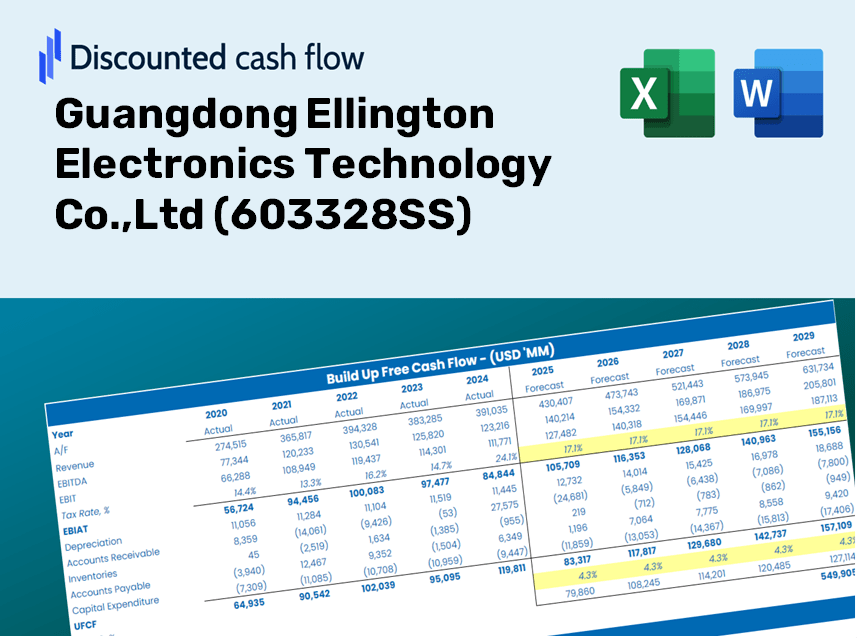
Guangdong Ellington Electronics Technology Co.,Ltd (603328.SS) Bundle
Como inversor o analista, esta calculadora DCF (603328SS) sirve como su herramienta esencial para una valoración precisa. Cargados con datos reales de Guangdong Ellington Electronics Technology Co., Ltd, puede ajustar fácilmente los pronósticos y observar los efectos inmediatos.
Discounted Cash Flow (DCF) - (USD MM)
| Year | AY1 2020 |
AY2 2021 |
AY3 2022 |
AY4 2023 |
AY5 2024 |
FY1 2025 |
FY2 2026 |
FY3 2027 |
FY4 2028 |
FY5 2029 |
|---|---|---|---|---|---|---|---|---|---|---|
| Revenue | 2,584.0 | 2,908.1 | 3,058.2 | 3,177.3 | 3,506.5 | 3,786.6 | 4,089.1 | 4,415.9 | 4,768.7 | 5,149.7 |
| Revenue Growth, % | 0 | 12.54 | 5.16 | 3.9 | 10.36 | 7.99 | 7.99 | 7.99 | 7.99 | 7.99 |
| EBITDA | 408.9 | 292.9 | 478.1 | 594.4 | 689.5 | 605.1 | 653.5 | 705.7 | 762.1 | 823.0 |
| EBITDA, % | 15.82 | 10.07 | 15.63 | 18.71 | 19.66 | 15.98 | 15.98 | 15.98 | 15.98 | 15.98 |
| Depreciation | 124.4 | 129.4 | 180.6 | 190.1 | 197.2 | 202.8 | 219.0 | 236.5 | 255.4 | 275.8 |
| Depreciation, % | 4.81 | 4.45 | 5.91 | 5.98 | 5.62 | 5.35 | 5.35 | 5.35 | 5.35 | 5.35 |
| EBIT | 284.5 | 163.6 | 297.5 | 404.3 | 492.3 | 402.4 | 434.5 | 469.2 | 506.7 | 547.2 |
| EBIT, % | 11.01 | 5.62 | 9.73 | 12.73 | 14.04 | 10.63 | 10.63 | 10.63 | 10.63 | 10.63 |
| Total Cash | 1,794.2 | 1,337.2 | 1,063.7 | 852.7 | 1,396.8 | 1,642.4 | 1,773.6 | 1,915.4 | 2,068.4 | 2,233.6 |
| Total Cash, percent | .0 | .0 | .0 | .0 | .0 | .0 | .0 | .0 | .0 | .0 |
| Account Receivables | 948.6 | 1,039.3 | 1,070.9 | 1,076.2 | 1,336.3 | 1,359.0 | 1,467.6 | 1,584.8 | 1,711.4 | 1,848.2 |
| Account Receivables, % | 36.71 | 35.74 | 35.02 | 33.87 | 38.11 | 35.89 | 35.89 | 35.89 | 35.89 | 35.89 |
| Inventories | 291.6 | 371.7 | 311.9 | 278.9 | 397.3 | 411.8 | 444.7 | 480.2 | 518.6 | 560.0 |
| Inventories, % | 11.28 | 12.78 | 10.2 | 8.78 | 11.33 | 10.88 | 10.88 | 10.88 | 10.88 | 10.88 |
| Accounts Payable | 802.0 | 1,122.8 | 1,019.1 | 824.7 | 1,016.5 | 1,195.9 | 1,291.5 | 1,394.7 | 1,506.1 | 1,626.4 |
| Accounts Payable, % | 31.04 | 38.61 | 33.32 | 25.96 | 28.99 | 31.58 | 31.58 | 31.58 | 31.58 | 31.58 |
| Capital Expenditure | -209.4 | -517.1 | -242.6 | -380.4 | -295.7 | -410.7 | -443.5 | -478.9 | -517.2 | -558.5 |
| Capital Expenditure, % | -8.1 | -17.78 | -7.93 | -11.97 | -8.43 | -10.85 | -10.85 | -10.85 | -10.85 | -10.85 |
| Tax Rate, % | 10.81 | 10.81 | 10.81 | 10.81 | 10.81 | 10.81 | 10.81 | 10.81 | 10.81 | 10.81 |
| EBITAT | 245.7 | 151.5 | 271.9 | 359.9 | 439.0 | 361.0 | 389.8 | 420.9 | 454.6 | 490.9 |
| Depreciation | ||||||||||
| Changes in Account Receivables | ||||||||||
| Changes in Inventories | ||||||||||
| Changes in Accounts Payable | ||||||||||
| Capital Expenditure | ||||||||||
| UFCF | -277.6 | -86.2 | 134.4 | 2.9 | 153.7 | 295.3 | 119.3 | 128.9 | 139.2 | 150.3 |
| WACC, % | 7.99 | 7.99 | 7.99 | 7.99 | 7.99 | 7.99 | 7.99 | 7.99 | 7.99 | 7.99 |
| PV UFCF | ||||||||||
| SUM PV UFCF | 682.8 | |||||||||
| Long Term Growth Rate, % | 2.00 | |||||||||
| Free cash flow (T + 1) | 153 | |||||||||
| Terminal Value | 2,559 | |||||||||
| Present Terminal Value | 1,742 | |||||||||
| Enterprise Value | 2,425 | |||||||||
| Net Debt | -530 | |||||||||
| Equity Value | 2,955 | |||||||||
| Diluted Shares Outstanding, MM | 998 | |||||||||
| Equity Value Per Share | 2.96 |
What You Will Receive
- Genuine 603328SS Financial Data: Access to historical and projected metrics for precise valuation.
- Customizable Inputs: Adjust WACC, tax rates, revenue growth, and capital expenditures as needed.
- Automated Calculations: Intrinsic value and NPV are computed in real-time.
- Scenario Analysis: Evaluate various scenarios to forecast Guangdong Ellington's future performance.
- User-Friendly Interface: Designed for industry professionals while remaining approachable for newcomers.
Key Features
- 🔍 Real-Life (603328SS) Financials: Pre-filled historical and projected data for Guangdong Ellington Electronics Technology Co., Ltd.
- ✏️ Fully Customizable Inputs: Adjust all key parameters (yellow cells) such as WACC, growth %, and tax rates.
- 📊 Professional DCF Valuation: Integrated formulas calculate the intrinsic value of Guangdong Ellington using the Discounted Cash Flow approach.
- ⚡ Instant Results: Visualize the company's valuation immediately upon making adjustments.
- Scenario Analysis: Evaluate and compare different financial assumptions side-by-side.
How It Works
- Step 1: Download the Excel file.
- Step 2: Review the pre-filled data for Guangdong Ellington Electronics Technology Co., Ltd (603328SS) (historical and projected).
- Step 3: Modify key assumptions (highlighted in yellow) based on your analysis.
- Step 4: Observe automatic recalculations to determine the intrinsic value of Guangdong Ellington Electronics Technology Co., Ltd (603328SS).
- Step 5: Utilize the results for your investment decisions or financial reporting.
Why Choose This Financial Tool?
- User-Friendly Interface: Suitable for both novices and seasoned professionals.
- Customizable Inputs: Adjust variables effortlessly to tailor your analysis.
- Real-Time Insights: Observe immediate updates to Guangdong Ellington Electronics' valuation as you modify inputs.
- Pre-Loaded Data: Comes equipped with Guangdong Ellington’s actual financial metrics for fast assessments.
- Relied Upon by Experts: Employed by investors and analysts for informed decision-making.
Who Can Benefit from This Product?
- Investors: Assess the valuation of Guangdong Ellington Electronics Technology Co., Ltd (603328SS) before making investment decisions.
- CFOs and Financial Analysts: Optimize valuation methodologies and evaluate financial projections.
- Startup Founders: Gain insights into how leading companies like Guangdong Ellington are valued in the market.
- Consultants: Create comprehensive valuation reports for your clients.
- Students and Educators: Utilize real-world data to practice and instruct on valuation strategies.
Contents of the Template
- Comprehensive DCF Model: Editable template featuring intricate valuation computations.
- Real-World Data: Guangdong Ellington Electronics Technology Co., Ltd’s historical and projected financials preloaded for thorough analysis.
- Customizable Parameters: Modify WACC, growth rates, and tax assumptions to explore various scenarios.
- Financial Statements: Complete annual and quarterly reports for enhanced insights.
- Key Ratios: Integrated analysis for assessing profitability, efficiency, and leverage.
- Dashboard with Visual Outputs: Visual representations such as charts and tables for clear, actionable insights.
Disclaimer
All information, articles, and product details provided on this website are for general informational and educational purposes only. We do not claim any ownership over, nor do we intend to infringe upon, any trademarks, copyrights, logos, brand names, or other intellectual property mentioned or depicted on this site. Such intellectual property remains the property of its respective owners, and any references here are made solely for identification or informational purposes, without implying any affiliation, endorsement, or partnership.
We make no representations or warranties, express or implied, regarding the accuracy, completeness, or suitability of any content or products presented. Nothing on this website should be construed as legal, tax, investment, financial, medical, or other professional advice. In addition, no part of this site—including articles or product references—constitutes a solicitation, recommendation, endorsement, advertisement, or offer to buy or sell any securities, franchises, or other financial instruments, particularly in jurisdictions where such activity would be unlawful.
All content is of a general nature and may not address the specific circumstances of any individual or entity. It is not a substitute for professional advice or services. Any actions you take based on the information provided here are strictly at your own risk. You accept full responsibility for any decisions or outcomes arising from your use of this website and agree to release us from any liability in connection with your use of, or reliance upon, the content or products found herein.