
|
Jack Technology Co., Ltd (603337.SS) Valoración de DCF |
Completamente Editable: Adáptelo A Sus Necesidades En Excel O Sheets
Diseño Profesional: Plantillas Confiables Y Estándares De La Industria
Predeterminadas Para Un Uso Rápido Y Eficiente
Compatible con MAC / PC, completamente desbloqueado
No Se Necesita Experiencia; Fáciles De Seguir
Jack Technology Co.,Ltd (603337.SS) Bundle
¡Simplifique Jack Technology Co., Valoración LTD (603337SS) con esta calculadora DCF personalizable! Con Real Jack Technology Co., Ltd (603337SS) financieras y entradas de pronóstico ajustables, puede probar escenarios y descubrir Jack Technology Co., LTD (603337SS) Valor razonable en minutos.
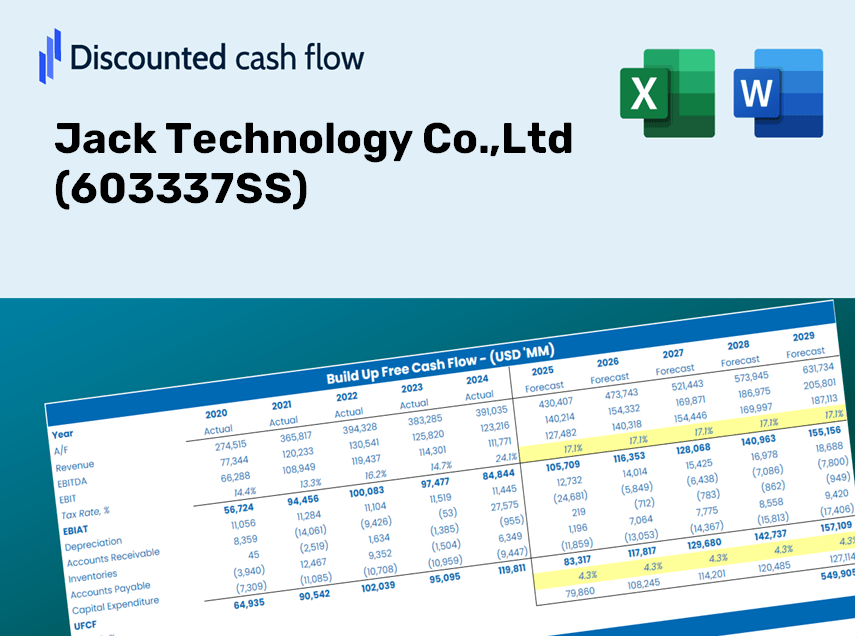
Discounted Cash Flow (DCF) - (USD MM)
| Year | AY1 2020 |
AY2 2021 |
AY3 2022 |
AY4 2023 |
AY5 2024 |
FY1 2025 |
FY2 2026 |
FY3 2027 |
FY4 2028 |
FY5 2029 |
|---|---|---|---|---|---|---|---|---|---|---|
| Revenue | 3,521.4 | 6,053.6 | 5,501.7 | 5,293.9 | 6,093.7 | 7,222.8 | 8,561.2 | 10,147.7 | 12,028.1 | 14,256.9 |
| Revenue Growth, % | 0 | 71.91 | -9.12 | -3.78 | 15.11 | 18.53 | 18.53 | 18.53 | 18.53 | 18.53 |
| EBITDA | 512.5 | 690.8 | 830.0 | 913.7 | 1,223.9 | 1,132.5 | 1,342.3 | 1,591.1 | 1,885.9 | 2,235.4 |
| EBITDA, % | 14.55 | 11.41 | 15.09 | 17.26 | 20.09 | 15.68 | 15.68 | 15.68 | 15.68 | 15.68 |
| Depreciation | 138.3 | 165.7 | 231.5 | 280.0 | 296.5 | 303.7 | 360.0 | 426.7 | 505.8 | 599.6 |
| Depreciation, % | 3.93 | 2.74 | 4.21 | 5.29 | 4.87 | 4.21 | 4.21 | 4.21 | 4.21 | 4.21 |
| EBIT | 374.2 | 525.1 | 598.5 | 633.8 | 927.4 | 828.7 | 982.3 | 1,164.3 | 1,380.1 | 1,635.8 |
| EBIT, % | 10.63 | 8.67 | 10.88 | 11.97 | 15.22 | 11.47 | 11.47 | 11.47 | 11.47 | 11.47 |
| Total Cash | 1,044.4 | 850.0 | 1,962.0 | 1,755.9 | 897.1 | 1,838.2 | 2,178.9 | 2,582.6 | 3,061.2 | 3,628.4 |
| Total Cash, percent | .0 | .0 | .0 | .0 | .0 | .0 | .0 | .0 | .0 | .0 |
| Account Receivables | 713.4 | 1,051.3 | 1,054.1 | 1,155.3 | 1,090.6 | 1,394.1 | 1,652.4 | 1,958.6 | 2,321.6 | 2,751.8 |
| Account Receivables, % | 20.26 | 17.37 | 19.16 | 21.82 | 17.9 | 19.3 | 19.3 | 19.3 | 19.3 | 19.3 |
| Inventories | 994.9 | 2,210.0 | 1,302.3 | 897.3 | 909.9 | 1,738.0 | 2,060.0 | 2,441.8 | 2,894.3 | 3,430.6 |
| Inventories, % | 28.25 | 36.51 | 23.67 | 16.95 | 14.93 | 24.06 | 24.06 | 24.06 | 24.06 | 24.06 |
| Accounts Payable | 956.7 | 1,699.5 | 933.7 | 1,093.0 | 1,150.4 | 1,614.1 | 1,913.2 | 2,267.8 | 2,688.0 | 3,186.1 |
| Accounts Payable, % | 27.17 | 28.07 | 16.97 | 20.65 | 18.88 | 22.35 | 22.35 | 22.35 | 22.35 | 22.35 |
| Capital Expenditure | -453.8 | -1,029.7 | -381.9 | -344.7 | -206.9 | -675.2 | -800.4 | -948.7 | -1,124.5 | -1,332.8 |
| Capital Expenditure, % | -12.89 | -17.01 | -6.94 | -6.51 | -3.39 | -9.35 | -9.35 | -9.35 | -9.35 | -9.35 |
| Tax Rate, % | 9.91 | 9.91 | 9.91 | 9.91 | 9.91 | 9.91 | 9.91 | 9.91 | 9.91 | 9.91 |
| EBITAT | 333.0 | 495.6 | 563.2 | 587.0 | 835.5 | 762.7 | 904.1 | 1,071.6 | 1,270.2 | 1,505.5 |
| Depreciation | ||||||||||
| Changes in Account Receivables | ||||||||||
| Changes in Inventories | ||||||||||
| Changes in Accounts Payable | ||||||||||
| Capital Expenditure | ||||||||||
| UFCF | -734.1 | -1,178.6 | 551.9 | 985.4 | 1,034.6 | -276.5 | 182.5 | 216.3 | 256.3 | 303.8 |
| WACC, % | 4.67 | 4.68 | 4.68 | 4.67 | 4.67 | 4.67 | 4.67 | 4.67 | 4.67 | 4.67 |
| PV UFCF | ||||||||||
| SUM PV UFCF | 546.3 | |||||||||
| Long Term Growth Rate, % | 3.50 | |||||||||
| Free cash flow (T + 1) | 314 | |||||||||
| Terminal Value | 26,819 | |||||||||
| Present Terminal Value | 21,344 | |||||||||
| Enterprise Value | 21,890 | |||||||||
| Net Debt | -206 | |||||||||
| Equity Value | 22,096 | |||||||||
| Diluted Shares Outstanding, MM | 464 | |||||||||
| Equity Value Per Share | 47.61 |
What You Will Receive
- Authentic Jack Technology Data: Comprehensive financial data – from revenue to EBIT – based on actual and projected figures.
- Complete Customization: Modify essential parameters (yellow cells) such as WACC, growth %, and tax rates.
- Immediate Valuation Updates: Automatic recalculations for assessing the effects of changes on Jack Technology’s fair value.
- Flexible Excel Template: Designed for quick adjustments, scenario analysis, and in-depth forecasting.
- Efficiency and Precision: Eliminate the need to create models from the ground up while ensuring accuracy and adaptability.
Key Features
- Authentic JTC Data: Pre-loaded with Jack Technology Co., Ltd's historical financial data and future projections.
- Completely Customizable Parameters: Tailor your inputs for revenue growth, profit margins, WACC, tax rates, and capital investments.
- Responsive Valuation Model: Automatic recalculations of Net Present Value (NPV) and intrinsic value based on your modifications.
- Scenario Analysis: Develop various forecast scenarios to evaluate different valuation possibilities.
- Intuitive Interface: Designed for both professionals and novices, offering a clear and organized layout.
How It Operates
- Obtain the Template: Gain immediate access to the Excel-based Jack Technology Co., Ltd. (603337SS) DCF Calculator.
- Enter Your Assumptions: Modify the yellow-highlighted cells to input growth rates, WACC, margins, and other variables.
- Real-Time Calculations: The model recalculates Jack Technology Co., Ltd.'s intrinsic value automatically.
- Explore Scenarios: Test various assumptions to assess possible changes in valuation.
- Evaluate and Decide: Utilize the outcomes to inform your investment strategies or financial evaluations.
Why Choose Jack Technology Co., Ltd (603337SS) Calculator?
- Precision: Leveraging real financial data from Jack Technology to ensure accuracy.
- Versatility: Built to allow users to experiment with and adjust inputs as needed.
- Efficiency: Eliminate the need to create a financial model from the ground up.
- Expert-Level: Crafted with the insight and usability expected by CFOs.
- Intuitive: Simple to navigate, making it accessible for users without extensive financial modeling skills.
Who Should Benefit from Jack Technology Co., Ltd (603337SS)?
- Institutional Investors: Develop comprehensive and accurate valuation models for assessing investment opportunities.
- Corporate Finance Departments: Evaluate valuation scenarios to inform strategic decision-making.
- Financial Consultants and Advisors: Deliver precise valuation insights for clients interested in Jack Technology Co., Ltd (603337SS).
- Academics and Students: Utilize real-world data for financial modeling practice and instruction.
- Tech Investors: Gain insights into the market valuation of tech companies like Jack Technology Co., Ltd (603337SS).
Contents of the Template
- Preloaded JTK Data: Comprehensive historical and forecasted financial data, including revenue, EBIT, and capital expenditures.
- DCF and WACC Models: Advanced spreadsheets designed to calculate intrinsic value and Weighted Average Cost of Capital.
- Editable Inputs: Cells highlighted in yellow for modifying revenue growth, tax rates, and discount rates.
- Financial Statements: Detailed annual and quarterly financial reports for in-depth analysis.
- Key Ratios: Metrics on profitability, leverage, and efficiency for performance assessment.
- Dashboard and Charts: Visual representations of valuation results and underlying assumptions.
Disclaimer
All information, articles, and product details provided on this website are for general informational and educational purposes only. We do not claim any ownership over, nor do we intend to infringe upon, any trademarks, copyrights, logos, brand names, or other intellectual property mentioned or depicted on this site. Such intellectual property remains the property of its respective owners, and any references here are made solely for identification or informational purposes, without implying any affiliation, endorsement, or partnership.
We make no representations or warranties, express or implied, regarding the accuracy, completeness, or suitability of any content or products presented. Nothing on this website should be construed as legal, tax, investment, financial, medical, or other professional advice. In addition, no part of this site—including articles or product references—constitutes a solicitation, recommendation, endorsement, advertisement, or offer to buy or sell any securities, franchises, or other financial instruments, particularly in jurisdictions where such activity would be unlawful.
All content is of a general nature and may not address the specific circumstances of any individual or entity. It is not a substitute for professional advice or services. Any actions you take based on the information provided here are strictly at your own risk. You accept full responsibility for any decisions or outcomes arising from your use of this website and agree to release us from any liability in connection with your use of, or reliance upon, the content or products found herein.