
|
Bafang Electric Co., Ltd. (603489.ss) Valoración de DCF |
Completamente Editable: Adáptelo A Sus Necesidades En Excel O Sheets
Diseño Profesional: Plantillas Confiables Y Estándares De La Industria
Predeterminadas Para Un Uso Rápido Y Eficiente
Compatible con MAC / PC, completamente desbloqueado
No Se Necesita Experiencia; Fáciles De Seguir
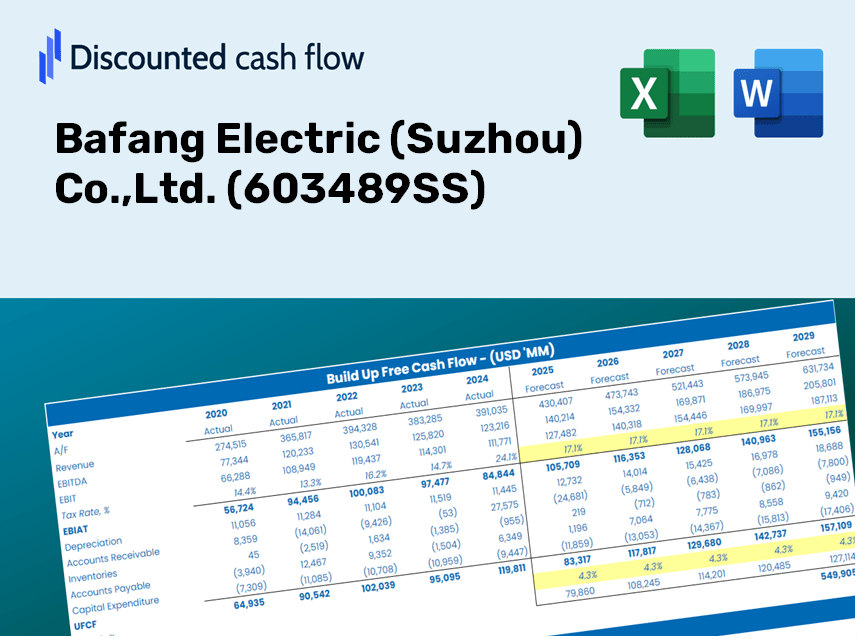
Bafang Electric (Suzhou) Co.,Ltd. (603489.SS) Bundle
Mejore sus opciones de inversión con el Bafang Electric (Suzhou) Co., Ltd. (603489SS) ¡Calculadora DCF! Explore los auténticos datos financieros de Bafang, ajuste las proyecciones y gastos de crecimiento, y presencie cómo estas modificaciones afectan el valor intrínseco de (603489SS) en tiempo real.
What You Will Receive
- Accurate Bafang Financial Data: Access to historical and projected figures for precise valuation.
- Customizable Parameters: Adjust WACC, tax rates, revenue growth, and capital expenses as needed.
- Automated Calculations: Intrinsic value and NPV are computed in real-time.
- Scenario Analysis: Explore various scenarios to assess Bafang’s future performance.
- User-Friendly Design: Designed for professionals but easy enough for newcomers to navigate.
Key Features
- Pre-Loaded Data: Historical financial statements and forecast data for Bafang Electric (Suzhou) Co.,Ltd. (603489SS).
- Fully Customizable Inputs: Adjust WACC, tax rates, revenue growth, and EBITDA margins to fit your analysis.
- Real-Time Results: Instantly view the recalculated intrinsic value for Bafang Electric (Suzhou) Co.,Ltd. (603489SS).
- Clear Visual Outputs: Comprehensive dashboard visualizations showcase valuation findings and essential metrics.
- Designed for Precision: A professional-grade tool tailored for analysts, investors, and finance professionals.
How It Operates
- Step 1: Download the prebuilt Excel template featuring Bafang Electric’s data.
- Step 2: Review the pre-filled worksheets to familiarize yourself with the essential metrics.
- Step 3: Modify the forecasts and assumptions in the editable yellow cells (WACC, growth, margins).
- Step 4: Instantly see updated results, including the intrinsic value of Bafang Electric (603489SS).
- Step 5: Make well-informed investment choices or create reports based on the outputs.
Why Opt for the Bafang Electric Calculator?
- Precision: Utilizes authentic Bafang financial data for reliable calculations.
- Adaptability: Crafted for users to easily experiment and adjust parameters as needed.
- Efficiency: Eliminate the complexities of constructing a financial model from the ground up.
- Expert-Level: Built with the accuracy and functionality that meets CFO standards.
- Intuitive: Designed for simplicity, making it accessible for users without extensive financial modeling skills.
Who Should Use This Product?
- Individual Investors: Make informed decisions regarding the purchase or sale of Bafang Electric (Suzhou) Co., Ltd. (603489SS) stock.
- Financial Analysts: Enhance valuation processes with pre-built financial models specific to Bafang Electric (Suzhou) Co., Ltd. (603489SS).
- Consultants: Provide accurate and timely valuation insights for clients utilizing Bafang Electric (Suzhou) Co., Ltd. (603489SS).
- Business Owners: Gain insights into how leading companies like Bafang Electric (Suzhou) Co., Ltd. (603489SS) are valued to inform your strategic decisions.
- Finance Students: Master valuation techniques through the analysis of real-world data and case studies involving Bafang Electric (Suzhou) Co., Ltd. (603489SS).
Contents of the Template
- Pre-Filled Data: Contains Bafang Electric’s historical financial data and projections.
- Discounted Cash Flow Model: An editable DCF valuation model featuring automatic calculations.
- Weighted Average Cost of Capital (WACC): A dedicated worksheet for WACC calculations based on user-defined inputs.
- Key Financial Ratios: Assess Bafang Electric’s profitability, efficiency, and capital structure.
- Customizable Inputs: Easily modify revenue growth rates, profit margins, and tax rates.
- Clear Dashboard: Visual representations and tables summarizing essential valuation metrics.
Disclaimer
All information, articles, and product details provided on this website are for general informational and educational purposes only. We do not claim any ownership over, nor do we intend to infringe upon, any trademarks, copyrights, logos, brand names, or other intellectual property mentioned or depicted on this site. Such intellectual property remains the property of its respective owners, and any references here are made solely for identification or informational purposes, without implying any affiliation, endorsement, or partnership.
We make no representations or warranties, express or implied, regarding the accuracy, completeness, or suitability of any content or products presented. Nothing on this website should be construed as legal, tax, investment, financial, medical, or other professional advice. In addition, no part of this site—including articles or product references—constitutes a solicitation, recommendation, endorsement, advertisement, or offer to buy or sell any securities, franchises, or other financial instruments, particularly in jurisdictions where such activity would be unlawful.
All content is of a general nature and may not address the specific circumstances of any individual or entity. It is not a substitute for professional advice or services. Any actions you take based on the information provided here are strictly at your own risk. You accept full responsibility for any decisions or outcomes arising from your use of this website and agree to release us from any liability in connection with your use of, or reliance upon, the content or products found herein.