
|
Beijing Tricolor Technology Co., Ltd (603516.ss) Valoración de DCF |
Completamente Editable: Adáptelo A Sus Necesidades En Excel O Sheets
Diseño Profesional: Plantillas Confiables Y Estándares De La Industria
Predeterminadas Para Un Uso Rápido Y Eficiente
Compatible con MAC / PC, completamente desbloqueado
No Se Necesita Experiencia; Fáciles De Seguir
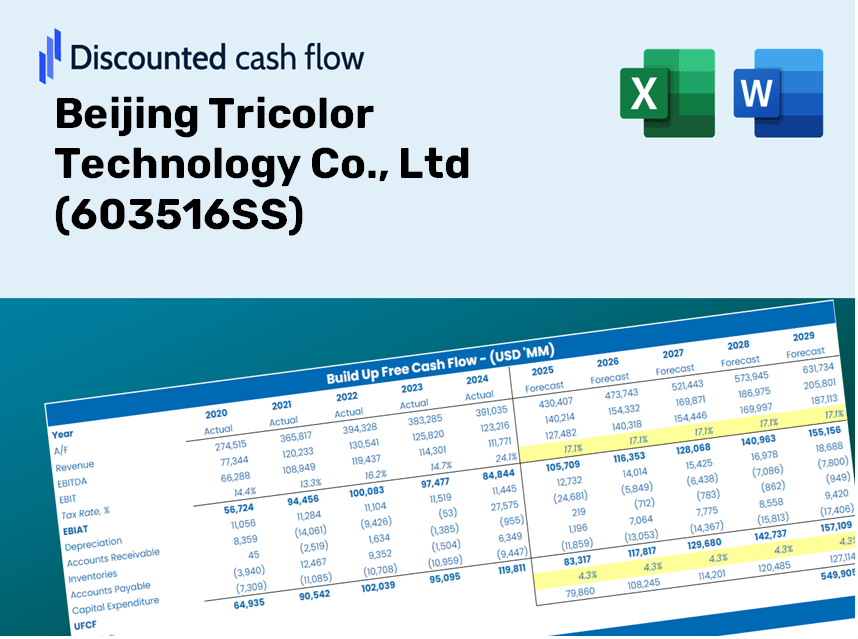
Beijing Tricolor Technology Co., Ltd (603516.SS) Bundle
Como inversor o analista, esta calculadora DCF [símbolo] es la herramienta perfecta para una valoración precisa. Precedidos con datos reales de Beijing Tricolor Technology Co., Ltd, puede ajustar fácilmente los pronósticos y observar los efectos en tiempo real.
Discounted Cash Flow (DCF) - (USD MM)
| Year | AY1 2020 |
AY2 2021 |
AY3 2022 |
AY4 2023 |
AY5 2024 |
FY1 2025 |
FY2 2026 |
FY3 2027 |
FY4 2028 |
FY5 2029 |
|---|---|---|---|---|---|---|---|---|---|---|
| Revenue | 482.6 | 468.1 | 380.8 | 499.0 | 494.9 | 505.5 | 516.3 | 527.3 | 538.6 | 550.2 |
| Revenue Growth, % | 0 | -3.01 | -18.65 | 31.03 | -0.82143 | 2.14 | 2.14 | 2.14 | 2.14 | 2.14 |
| EBITDA | 130.3 | 114.5 | 56.8 | 40.1 | 86.4 | 92.9 | 94.9 | 96.9 | 99.0 | 101.1 |
| EBITDA, % | 26.99 | 24.46 | 14.92 | 8.04 | 17.47 | 18.37 | 18.37 | 18.37 | 18.37 | 18.37 |
| Depreciation | 9.1 | 18.1 | 24.2 | 22.5 | 19.3 | 20.7 | 21.2 | 21.6 | 22.1 | 22.6 |
| Depreciation, % | 1.89 | 3.86 | 6.37 | 4.51 | 3.89 | 4.1 | 4.1 | 4.1 | 4.1 | 4.1 |
| EBIT | 121.2 | 96.4 | 32.6 | 17.6 | 67.2 | 72.1 | 73.7 | 75.3 | 76.9 | 78.5 |
| EBIT, % | 25.1 | 20.59 | 8.55 | 3.53 | 13.58 | 14.27 | 14.27 | 14.27 | 14.27 | 14.27 |
| Total Cash | 668.6 | 662.6 | 605.3 | 788.6 | 827.0 | 505.5 | 516.3 | 527.3 | 538.6 | 550.2 |
| Total Cash, percent | .0 | .0 | .0 | .0 | .0 | .0 | .0 | .0 | .0 | .0 |
| Account Receivables | 248.5 | 254.0 | 249.4 | 251.4 | 242.7 | 273.6 | 279.5 | 285.5 | 291.6 | 297.8 |
| Account Receivables, % | 51.48 | 54.26 | 65.49 | 50.39 | 49.05 | 54.14 | 54.14 | 54.14 | 54.14 | 54.14 |
| Inventories | 77.8 | 99.7 | 97.6 | 82.8 | 89.1 | 98.7 | 100.8 | 103.0 | 105.2 | 107.4 |
| Inventories, % | 16.13 | 21.3 | 25.63 | 16.6 | 18 | 19.53 | 19.53 | 19.53 | 19.53 | 19.53 |
| Accounts Payable | 54.5 | 52.0 | 58.5 | 122.1 | 65.9 | 76.4 | 78.0 | 79.7 | 81.4 | 83.1 |
| Accounts Payable, % | 11.29 | 11.1 | 15.36 | 24.46 | 13.32 | 15.11 | 15.11 | 15.11 | 15.11 | 15.11 |
| Capital Expenditure | -41.7 | -38.2 | -15.2 | -3.6 | -2.4 | -22.2 | -22.7 | -23.2 | -23.7 | -24.2 |
| Capital Expenditure, % | -8.64 | -8.15 | -3.99 | -0.72841 | -0.49208 | -4.4 | -4.4 | -4.4 | -4.4 | -4.4 |
| Tax Rate, % | -5.28 | -5.28 | -5.28 | -5.28 | -5.28 | -5.28 | -5.28 | -5.28 | -5.28 | -5.28 |
| EBITAT | 124.2 | 81.3 | 25.0 | 20.0 | 70.7 | 66.5 | 67.9 | 69.4 | 70.9 | 72.4 |
| Depreciation | ||||||||||
| Changes in Account Receivables | ||||||||||
| Changes in Inventories | ||||||||||
| Changes in Accounts Payable | ||||||||||
| Capital Expenditure | ||||||||||
| UFCF | -180.2 | 31.3 | 47.2 | 115.3 | 33.9 | 34.9 | 60.1 | 61.4 | 62.7 | 64.0 |
| WACC, % | 9.18 | 9.17 | 9.17 | 9.18 | 9.18 | 9.17 | 9.17 | 9.17 | 9.17 | 9.17 |
| PV UFCF | ||||||||||
| SUM PV UFCF | 214.9 | |||||||||
| Long Term Growth Rate, % | 2.00 | |||||||||
| Free cash flow (T + 1) | 65 | |||||||||
| Terminal Value | 910 | |||||||||
| Present Terminal Value | 587 | |||||||||
| Enterprise Value | 802 | |||||||||
| Net Debt | -628 | |||||||||
| Equity Value | 1,430 | |||||||||
| Diluted Shares Outstanding, MM | 200 | |||||||||
| Equity Value Per Share | 7.17 |
Benefits You Will Receive
- Customizable Excel Template: A versatile Excel-based DCF Calculator featuring pre-filled financial data for Beijing Tricolor Technology Co., Ltd (603516SS).
- Comprehensive Data: Access to historical performance data along with forward-looking projections (highlighted in the yellow cells).
- Flexible Forecasting: Adjust key assumptions such as revenue growth rates, EBITDA percentages, and WACC to suit your analysis.
- Instant Calculations: Quickly observe how your adjustments affect the valuation of Beijing Tricolor Technology Co., Ltd (603516SS).
- Professional-Grade Tool: Designed for investors, CFOs, consultants, and financial analysts seeking in-depth insights.
- Intuitive Design: Organized for simplicity and effectiveness, complete with step-by-step guidance.
Key Features
- Authentic Financial Data for Beijing Tricolor Technology: Access reliable historical data and future forecasts tailored for [603516SS].
- Adjustable Forecast Parameters: Modify highlighted cells for key metrics such as WACC, growth rates, and profit margins.
- Real-Time Calculations: Enjoy automatic updates for DCF, Net Present Value (NPV), and cash flow analysis.
- User-Friendly Dashboard: Utilize intuitive charts and summaries to present your valuation findings effectively.
- Designed for All Skill Levels: A straightforward layout suitable for investors, CFOs, and consultants alike.
How It Functions
- Download: Get the pre-prepared Excel file containing financial data for Beijing Tricolor Technology Co., Ltd (603516SS).
- Customize: Tailor forecasts, including revenue growth, EBITDA %, and WACC to suit your analysis.
- Update Automatically: The intrinsic value and NPV calculations refresh in real-time.
- Test Scenarios: Develop multiple projections and instantly compare the results.
- Make Decisions: Utilize the valuation outcomes to inform your investment strategy.
Why Opt for This Calculator?
- User-Friendly: Tailored for both novices and seasoned users.
- Adjustable Inputs: Effortlessly change parameters to suit your analysis.
- Real-Time Feedback: Observe immediate updates to Beijing Tricolor Technology Co., Ltd’s valuation as you modify inputs.
- Preloaded Data: Comes equipped with actual financial data for quick evaluations of Beijing Tricolor Technology Co., Ltd (603516SS).
- Relied Upon by Experts: Utilized by investors and analysts for making well-informed decisions.
Who Can Benefit from Our Services?
- Finance Students: Explore valuation methodologies with hands-on experience using real data.
- Researchers: Integrate established financial models into educational projects or academic studies.
- Investors: Validate your hypotheses and assess valuation results for Beijing Tricolor Technology Co., Ltd (603516SS).
- Financial Analysts: Enhance your efficiency with a ready-to-use and customizable DCF model.
- Entrepreneurs: Discover how major public companies like Beijing Tricolor Technology Co., Ltd (603516SS) are evaluated in the market.
Contents of the Template
- Preloaded 603516SS Data: Historical and forecasted financial information, including revenue, EBIT, and capital expenditures.
- DCF and WACC Models: Advanced worksheets for determining intrinsic value and Weighted Average Cost of Capital.
- Editable Inputs: Yellow-highlighted fields for modifying revenue growth rates, tax percentages, and discount rates.
- Financial Statements: Detailed annual and quarterly financial reports for in-depth analysis.
- Key Ratios: Metrics for profitability, leverage, and efficiency to assess performance.
- Dashboard and Charts: Visual representations of valuation results and underlying assumptions.
Disclaimer
All information, articles, and product details provided on this website are for general informational and educational purposes only. We do not claim any ownership over, nor do we intend to infringe upon, any trademarks, copyrights, logos, brand names, or other intellectual property mentioned or depicted on this site. Such intellectual property remains the property of its respective owners, and any references here are made solely for identification or informational purposes, without implying any affiliation, endorsement, or partnership.
We make no representations or warranties, express or implied, regarding the accuracy, completeness, or suitability of any content or products presented. Nothing on this website should be construed as legal, tax, investment, financial, medical, or other professional advice. In addition, no part of this site—including articles or product references—constitutes a solicitation, recommendation, endorsement, advertisement, or offer to buy or sell any securities, franchises, or other financial instruments, particularly in jurisdictions where such activity would be unlawful.
All content is of a general nature and may not address the specific circumstances of any individual or entity. It is not a substitute for professional advice or services. Any actions you take based on the information provided here are strictly at your own risk. You accept full responsibility for any decisions or outcomes arising from your use of this website and agree to release us from any liability in connection with your use of, or reliance upon, the content or products found herein.