
|
Sunstone Development Co., Ltd. (603612.ss) Valoración de DCF |
Completamente Editable: Adáptelo A Sus Necesidades En Excel O Sheets
Diseño Profesional: Plantillas Confiables Y Estándares De La Industria
Predeterminadas Para Un Uso Rápido Y Eficiente
Compatible con MAC / PC, completamente desbloqueado
No Se Necesita Experiencia; Fáciles De Seguir
Sunstone Development Co., Ltd. (603612.SS) Bundle
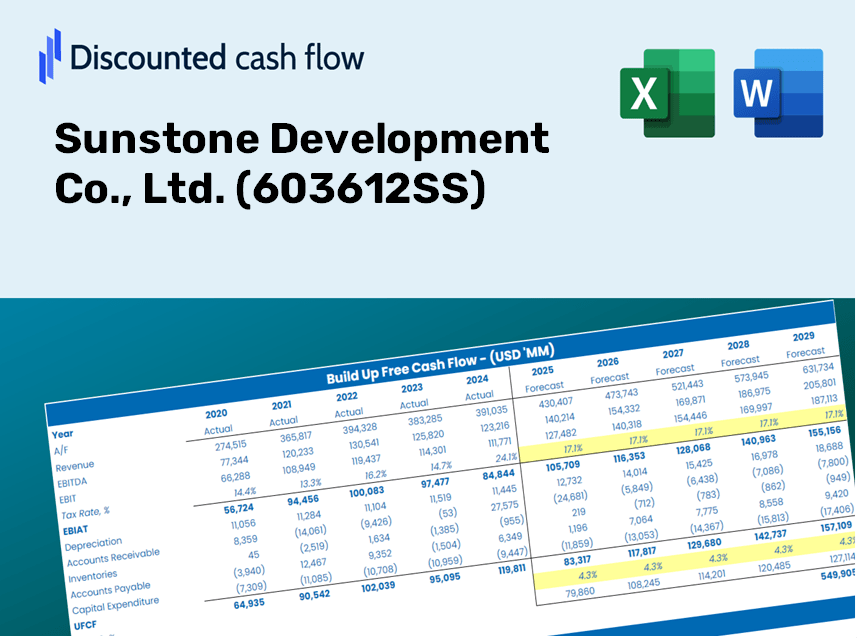
¡Obtenga información sobre su análisis de valoración de Sunstone Development Co., Ltd. (603612SS) con nuestra sofisticada calculadora DCF! Esta plantilla de Excel viene precargada con datos reales (603612SS), lo que le permite ajustar los pronósticos y los supuestos para determinar con precisión el valor intrínseco de Sunstone Development Co., Ltd.
Discounted Cash Flow (DCF) - (USD MM)
| Year | AY1 2020 |
AY2 2021 |
AY3 2022 |
AY4 2023 |
AY5 2024 |
FY1 2025 |
FY2 2026 |
FY3 2027 |
FY4 2028 |
FY5 2029 |
|---|---|---|---|---|---|---|---|---|---|---|
| Revenue | 5,850.8 | 9,457.9 | 19,400.6 | 15,310.6 | 13,749.8 | 18,231.4 | 24,173.7 | 32,052.9 | 42,500.2 | 56,352.6 |
| Revenue Growth, % | 0 | 61.65 | 105.12 | -21.08 | -10.19 | 32.59 | 32.59 | 32.59 | 32.59 | 32.59 |
| EBITDA | 871.4 | 1,497.1 | 2,230.6 | -60.2 | 1,489.2 | 1,920.1 | 2,545.9 | 3,375.7 | 4,476.0 | 5,934.9 |
| EBITDA, % | 14.89 | 15.83 | 11.5 | -0.3933 | 10.83 | 10.53 | 10.53 | 10.53 | 10.53 | 10.53 |
| Depreciation | 356.1 | 373.8 | 482.8 | 544.8 | 678.0 | 766.3 | 1,016.1 | 1,347.2 | 1,786.3 | 2,368.6 |
| Depreciation, % | 6.09 | 3.95 | 2.49 | 3.56 | 4.93 | 4.2 | 4.2 | 4.2 | 4.2 | 4.2 |
| EBIT | 515.4 | 1,123.3 | 1,747.9 | -605.0 | 811.2 | 1,153.8 | 1,529.9 | 2,028.5 | 2,689.7 | 3,566.3 |
| EBIT, % | 8.81 | 11.88 | 9.01 | -3.95 | 5.9 | 6.33 | 6.33 | 6.33 | 6.33 | 6.33 |
| Total Cash | 1,315.3 | 1,774.7 | 2,987.8 | 3,013.1 | 2,180.0 | 3,361.1 | 4,456.6 | 5,909.2 | 7,835.2 | 10,389.0 |
| Total Cash, percent | .0 | .0 | .0 | .0 | .0 | .0 | .0 | .0 | .0 | .0 |
| Account Receivables | 1,441.4 | 1,945.9 | 3,379.1 | 3,279.3 | 3,704.9 | 4,047.1 | 5,366.2 | 7,115.2 | 9,434.4 | 12,509.4 |
| Account Receivables, % | 24.64 | 20.57 | 17.42 | 21.42 | 26.95 | 22.2 | 22.2 | 22.2 | 22.2 | 22.2 |
| Inventories | 1,268.9 | 3,187.9 | 4,658.6 | 2,514.9 | 2,741.9 | 4,221.4 | 5,597.3 | 7,421.7 | 9,840.8 | 13,048.2 |
| Inventories, % | 21.69 | 33.71 | 24.01 | 16.43 | 19.94 | 23.15 | 23.15 | 23.15 | 23.15 | 23.15 |
| Accounts Payable | 793.6 | 975.1 | 1,285.9 | 1,361.4 | 1,589.8 | 1,858.0 | 2,463.6 | 3,266.6 | 4,331.3 | 5,743.1 |
| Accounts Payable, % | 13.56 | 10.31 | 6.63 | 8.89 | 11.56 | 10.19 | 10.19 | 10.19 | 10.19 | 10.19 |
| Capital Expenditure | -669.2 | -687.0 | -966.3 | -1,299.2 | -694.1 | -1,357.0 | -1,799.3 | -2,385.8 | -3,163.4 | -4,194.4 |
| Capital Expenditure, % | -11.44 | -7.26 | -4.98 | -8.49 | -5.05 | -7.44 | -7.44 | -7.44 | -7.44 | -7.44 |
| Tax Rate, % | 49.32 | 49.32 | 49.32 | 49.32 | 49.32 | 49.32 | 49.32 | 49.32 | 49.32 | 49.32 |
| EBITAT | 399.9 | 723.4 | 1,084.5 | -481.9 | 411.2 | 771.6 | 1,023.1 | 1,356.5 | 1,798.7 | 2,385.0 |
| Depreciation | ||||||||||
| Changes in Account Receivables | ||||||||||
| Changes in Inventories | ||||||||||
| Changes in Accounts Payable | ||||||||||
| Capital Expenditure | ||||||||||
| UFCF | -1,830.0 | -1,831.8 | -1,992.2 | 1,082.7 | -29.1 | -1,372.6 | -1,849.6 | -2,452.4 | -3,251.8 | -4,311.6 |
| WACC, % | 5.42 | 5.24 | 5.21 | 5.45 | 5.05 | 5.27 | 5.27 | 5.27 | 5.27 | 5.27 |
| PV UFCF | ||||||||||
| SUM PV UFCF | -11,056.9 | |||||||||
| Long Term Growth Rate, % | 3.50 | |||||||||
| Free cash flow (T + 1) | -4,463 | |||||||||
| Terminal Value | -251,578 | |||||||||
| Present Terminal Value | -194,568 | |||||||||
| Enterprise Value | -205,625 | |||||||||
| Net Debt | 4,137 | |||||||||
| Equity Value | -209,761 | |||||||||
| Diluted Shares Outstanding, MM | 524 | |||||||||
| Equity Value Per Share | -400.41 |
What You Will Receive
- Authentic Sunstone Data: Preloaded financial metrics – including revenue and EBIT – derived from actual and projected figures for Sunstone Development Co., Ltd. (603612SS).
- Comprehensive Customization: Modify all essential parameters (yellow cells) such as WACC, growth %, and tax rates to fit your analysis.
- Instant Valuation Adjustments: Automatic recalculations to assess how changes affect the fair value of Sunstone Development Co., Ltd. (603612SS).
- User-Friendly Excel Template: Designed for easy adjustments, scenario analysis, and in-depth forecasting.
- Efficient and Precise: Save time by avoiding the need to build models from scratch, while ensuring accuracy and adaptability.
Key Features
- 🔍 Real-Life Sunstone Development Financials: Pre-filled historical and projected data for Sunstone Development Co., Ltd. (603612SS).
- ✏️ Fully Customizable Inputs: Adjust all critical parameters (yellow cells) such as WACC, growth %, and tax rates.
- 📊 Professional DCF Valuation: Built-in formulas compute Sunstone's intrinsic value using the Discounted Cash Flow method.
- ⚡ Instant Results: Visualize Sunstone's valuation immediately after making adjustments.
- Scenario Analysis: Explore and compare different outcomes based on various financial assumptions side-by-side.
How It Functions
- 1. Access the Template: Download and open the Excel file containing Sunstone Development Co., Ltd.'s (603612SS) preloaded data.
- 2. Modify Assumptions: Adjust essential inputs such as growth rates, WACC, and capital expenditures.
- 3. View Immediate Results: The DCF model automatically calculates intrinsic value and NPV in real time.
- 4. Explore Scenarios: Evaluate various forecasts to understand different valuation possibilities.
- 5. Present with Assurance: Deliver professional valuation insights to enhance your decision-making process.
Why Choose Sunstone Development's Calculator?
- Precise Data: Utilize accurate financial information for trustworthy valuation outcomes.
- Flexible Options: Modify essential parameters such as growth rates, WACC, and tax rates to align with your forecasts.
- Efficient: Ready-to-use calculations save you time and eliminate the need for initial setup.
- Professional-Quality Tool: Tailored for investors, analysts, and consultants in the field.
- Easy to Use: An intuitive design and clear step-by-step guidance make it accessible for everyone.
Who Should Consider This Product?
- Investors: Evaluate Sunstone Development Co., Ltd.'s (603612SS) market position prior to making investment decisions.
- CFOs and Financial Analysts: Enhance valuation workflows and assess financial forecasts for accuracy.
- Startup Founders: Gain insights into the valuation methodologies applied to established companies like Sunstone Development Co., Ltd. (603612SS).
- Consultants: Provide your clients with detailed and professional valuation reports.
- Students and Educators: Utilize practical data for hands-on experience and teaching valuation strategies.
Components of the Template
- Pre-Filled DCF Model: Financial data for Sunstone Development Co., Ltd. (603612SS) ready to use.
- WACC Calculator: Comprehensive calculations for Weighted Average Cost of Capital.
- Financial Ratios: Analyze Sunstone's profitability, leverage, and operational efficiency.
- Editable Inputs: Adjust assumptions like growth rates, profit margins, and capital expenditures to align with your scenarios.
- Financial Statements: Access annual and quarterly reports for in-depth analysis.
- Interactive Dashboard: Effortlessly visualize essential valuation metrics and outcomes.
Disclaimer
All information, articles, and product details provided on this website are for general informational and educational purposes only. We do not claim any ownership over, nor do we intend to infringe upon, any trademarks, copyrights, logos, brand names, or other intellectual property mentioned or depicted on this site. Such intellectual property remains the property of its respective owners, and any references here are made solely for identification or informational purposes, without implying any affiliation, endorsement, or partnership.
We make no representations or warranties, express or implied, regarding the accuracy, completeness, or suitability of any content or products presented. Nothing on this website should be construed as legal, tax, investment, financial, medical, or other professional advice. In addition, no part of this site—including articles or product references—constitutes a solicitation, recommendation, endorsement, advertisement, or offer to buy or sell any securities, franchises, or other financial instruments, particularly in jurisdictions where such activity would be unlawful.
All content is of a general nature and may not address the specific circumstances of any individual or entity. It is not a substitute for professional advice or services. Any actions you take based on the information provided here are strictly at your own risk. You accept full responsibility for any decisions or outcomes arising from your use of this website and agree to release us from any liability in connection with your use of, or reliance upon, the content or products found herein.