
|
Zhejiang XCC Group Co., Ltd (603667.SS) Valoración de DCF |
Completamente Editable: Adáptelo A Sus Necesidades En Excel O Sheets
Diseño Profesional: Plantillas Confiables Y Estándares De La Industria
Predeterminadas Para Un Uso Rápido Y Eficiente
Compatible con MAC / PC, completamente desbloqueado
No Se Necesita Experiencia; Fáciles De Seguir
Zhejiang XCC Group Co.,Ltd (603667.SS) Bundle
¡Explore el potencial financiero de Zhejiang XCC Group Co., Ltd (603667SS) con nuestra calculadora DCF fácil de usar! Ingrese sus suposiciones con respecto al crecimiento, los márgenes y los gastos para calcular el valor intrínseco de Zhejiang XCC Group Co., LTD (603667SS) y refinar su estrategia de inversión.
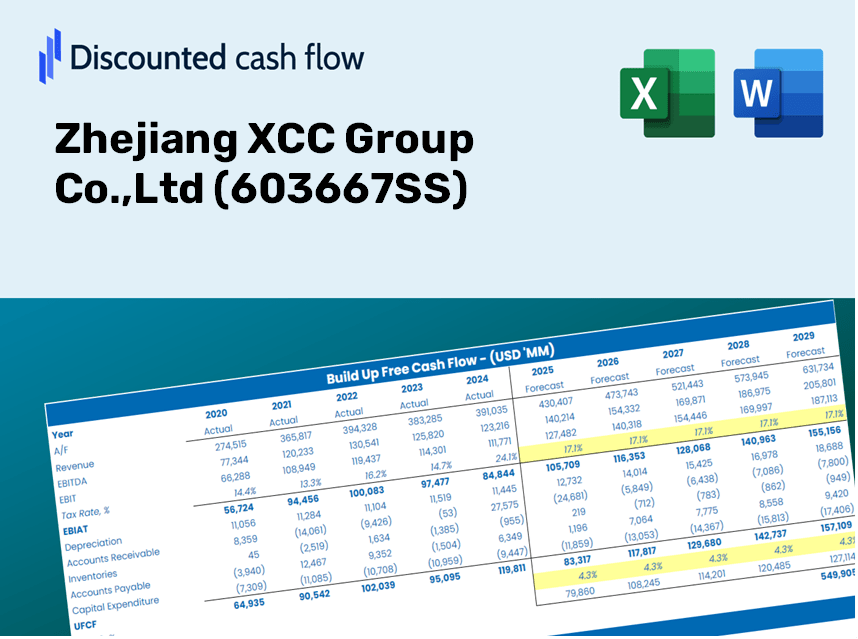
Discounted Cash Flow (DCF) - (USD MM)
| Year | AY1 2020 |
AY2 2021 |
AY3 2022 |
AY4 2023 |
AY5 2024 |
FY1 2025 |
FY2 2026 |
FY3 2027 |
FY4 2028 |
FY5 2029 |
|---|---|---|---|---|---|---|---|---|---|---|
| Revenue | 1,754.0 | 2,423.2 | 3,200.3 | 3,106.1 | 3,264.5 | 3,855.3 | 4,552.9 | 5,376.8 | 6,349.7 | 7,498.7 |
| Revenue Growth, % | 0 | 38.15 | 32.07 | -2.95 | 5.1 | 18.1 | 18.1 | 18.1 | 18.1 | 18.1 |
| EBITDA | 222.4 | 281.6 | 278.7 | 324.6 | 278.4 | 400.8 | 473.4 | 559.0 | 660.2 | 779.6 |
| EBITDA, % | 12.68 | 11.62 | 8.71 | 10.45 | 8.53 | 10.4 | 10.4 | 10.4 | 10.4 | 10.4 |
| Depreciation | 109.7 | 117.3 | 133.3 | 156.8 | 159.0 | 194.1 | 229.3 | 270.8 | 319.8 | 377.6 |
| Depreciation, % | 6.26 | 4.84 | 4.16 | 5.05 | 4.87 | 5.04 | 5.04 | 5.04 | 5.04 | 5.04 |
| EBIT | 112.6 | 164.3 | 145.5 | 167.8 | 119.5 | 206.7 | 244.1 | 288.3 | 340.4 | 402.0 |
| EBIT, % | 6.42 | 6.78 | 4.54 | 5.4 | 3.66 | 5.36 | 5.36 | 5.36 | 5.36 | 5.36 |
| Total Cash | 401.2 | 529.8 | 438.7 | 751.4 | 612.6 | 781.9 | 923.4 | 1,090.4 | 1,287.8 | 1,520.8 |
| Total Cash, percent | .0 | .0 | .0 | .0 | .0 | .0 | .0 | .0 | .0 | .0 |
| Account Receivables | 689.5 | 832.0 | 928.8 | 952.6 | 1,085.6 | 1,284.5 | 1,516.9 | 1,791.4 | 2,115.6 | 2,498.4 |
| Account Receivables, % | 39.31 | 34.33 | 29.02 | 30.67 | 33.25 | 33.32 | 33.32 | 33.32 | 33.32 | 33.32 |
| Inventories | 544.8 | 862.0 | 900.4 | 791.8 | 934.3 | 1,148.0 | 1,355.7 | 1,601.0 | 1,890.7 | 2,232.9 |
| Inventories, % | 31.06 | 35.57 | 28.14 | 25.49 | 28.62 | 29.78 | 29.78 | 29.78 | 29.78 | 29.78 |
| Accounts Payable | 432.8 | 628.6 | 262.1 | 409.5 | 867.6 | 760.0 | 897.5 | 1,059.9 | 1,251.7 | 1,478.2 |
| Accounts Payable, % | 24.68 | 25.94 | 8.19 | 13.18 | 26.58 | 19.71 | 19.71 | 19.71 | 19.71 | 19.71 |
| Capital Expenditure | -204.8 | -280.3 | -193.3 | -172.9 | -128.1 | -299.0 | -353.1 | -417.0 | -492.5 | -581.6 |
| Capital Expenditure, % | -11.68 | -11.57 | -6.04 | -5.57 | -3.93 | -7.76 | -7.76 | -7.76 | -7.76 | -7.76 |
| Tax Rate, % | 13.89 | 13.89 | 13.89 | 13.89 | 13.89 | 13.89 | 13.89 | 13.89 | 13.89 | 13.89 |
| EBITAT | 90.8 | 133.4 | 121.9 | 142.2 | 102.9 | 172.2 | 203.4 | 240.2 | 283.6 | 334.9 |
| Depreciation | ||||||||||
| Changes in Account Receivables | ||||||||||
| Changes in Inventories | ||||||||||
| Changes in Accounts Payable | ||||||||||
| Capital Expenditure | ||||||||||
| UFCF | -805.8 | -293.5 | -440.0 | 358.4 | 316.3 | -452.9 | -223.1 | -263.5 | -311.2 | -367.5 |
| WACC, % | 5.25 | 5.25 | 5.25 | 5.26 | 5.26 | 5.25 | 5.25 | 5.25 | 5.25 | 5.25 |
| PV UFCF | ||||||||||
| SUM PV UFCF | -1,395.8 | |||||||||
| Long Term Growth Rate, % | 3.50 | |||||||||
| Free cash flow (T + 1) | -380 | |||||||||
| Terminal Value | -21,704 | |||||||||
| Present Terminal Value | -16,803 | |||||||||
| Enterprise Value | -18,199 | |||||||||
| Net Debt | 313 | |||||||||
| Equity Value | -18,511 | |||||||||
| Diluted Shares Outstanding, MM | 365 | |||||||||
| Equity Value Per Share | -50.65 |
Benefits of Using This Template
- Adjustable Forecast Parameters: Seamlessly modify key assumptions (growth %, margins, WACC) to explore different scenarios.
- Pre-Populated Real-World Data: Financial metrics for Zhejiang XCC Group Co., Ltd. (603667SS) included to streamline your analysis.
- Automatic DCF Calculations: The template computes Net Present Value (NPV) and intrinsic value for you automatically.
- Professional and Customizable: An elegant Excel model designed to meet your specific valuation requirements.
- Tailored for Analysts and Investors: Perfect for assessing forecasts, confirming strategies, and enhancing efficiency.
Key Features
- 🔍 Real-Life XCC Financials: Pre-filled historical and projected data for Zhejiang XCC Group Co., Ltd (603667SS).
- ✏️ Fully Customizable Inputs: Adjust all critical parameters (yellow cells) such as WACC, growth %, and tax rates.
- 📊 Professional DCF Valuation: Built-in formulas calculate Zhejiang XCC's intrinsic value using the Discounted Cash Flow method.
- ⚡ Instant Results: Visualize Zhejiang XCC's valuation immediately after making adjustments.
- Scenario Analysis: Test and compare outcomes for various financial assumptions side-by-side.
How It Operates
- Step 1: Download the Excel file.
- Step 2: Examine Zhejiang XCC Group Co.,Ltd’s pre-filled financial data and projections.
- Step 3: Adjust key parameters such as revenue growth, WACC, and tax rates (highlighted cells).
- Step 4: Watch the DCF model refresh in real-time as you modify your assumptions.
- Step 5: Review the outputs and apply the findings to inform your investment choices.
Why Opt for This Calculator?
- Designed for Experts: A sophisticated tool utilized by analysts, CFOs, and consultants.
- Accurate Financial Data: Zhejiang XCC Group Co., Ltd's (603667SS) historical and projected financials integrated for precision.
- Flexible Scenario Analysis: Effortlessly simulate various forecasts and assumptions.
- Comprehensive Outputs: Automatically determines intrinsic value, NPV, and essential financial metrics.
- User-Friendly: Step-by-step guidance makes navigation straightforward.
Who Can Benefit from This Product?
- Finance Students: Explore valuation methods and apply them using real-time data for Zhejiang XCC Group Co.,Ltd (603667SS).
- Academics: Integrate industry-standard models into your curriculum or research involving Zhejiang XCC Group Co.,Ltd (603667SS).
- Investors: Validate your investment strategies and analyze valuation results for Zhejiang XCC Group Co.,Ltd (603667SS).
- Analysts: Enhance your productivity with a ready-to-use, customizable DCF model tailored for Zhejiang XCC Group Co.,Ltd (603667SS).
- Small Business Owners: Understand how major public companies like Zhejiang XCC Group Co.,Ltd (603667SS) are evaluated.
Contents of the Template
- Operating and Balance Sheet Data: Pre-populated historical data and forecasts for Zhejiang XCC Group Co., Ltd (603667SS), including metrics such as revenue, EBITDA, EBIT, and capital expenditures.
- WACC Calculation: A specific sheet for calculating the Weighted Average Cost of Capital (WACC), featuring crucial parameters like Beta, risk-free rate, and share price.
- DCF Valuation (Unlevered and Levered): Customizable Discounted Cash Flow models showcasing intrinsic value with comprehensive calculations.
- Financial Statements: Pre-loaded annual and quarterly financial statements to facilitate analysis.
- Key Ratios: Includes vital profitability, leverage, and efficiency ratios pertinent to Zhejiang XCC Group Co., Ltd (603667SS).
- Dashboard and Charts: Visual summary of valuation outputs and underlying assumptions to simplify result analysis.
Disclaimer
All information, articles, and product details provided on this website are for general informational and educational purposes only. We do not claim any ownership over, nor do we intend to infringe upon, any trademarks, copyrights, logos, brand names, or other intellectual property mentioned or depicted on this site. Such intellectual property remains the property of its respective owners, and any references here are made solely for identification or informational purposes, without implying any affiliation, endorsement, or partnership.
We make no representations or warranties, express or implied, regarding the accuracy, completeness, or suitability of any content or products presented. Nothing on this website should be construed as legal, tax, investment, financial, medical, or other professional advice. In addition, no part of this site—including articles or product references—constitutes a solicitation, recommendation, endorsement, advertisement, or offer to buy or sell any securities, franchises, or other financial instruments, particularly in jurisdictions where such activity would be unlawful.
All content is of a general nature and may not address the specific circumstances of any individual or entity. It is not a substitute for professional advice or services. Any actions you take based on the information provided here are strictly at your own risk. You accept full responsibility for any decisions or outcomes arising from your use of this website and agree to release us from any liability in connection with your use of, or reliance upon, the content or products found herein.