
|
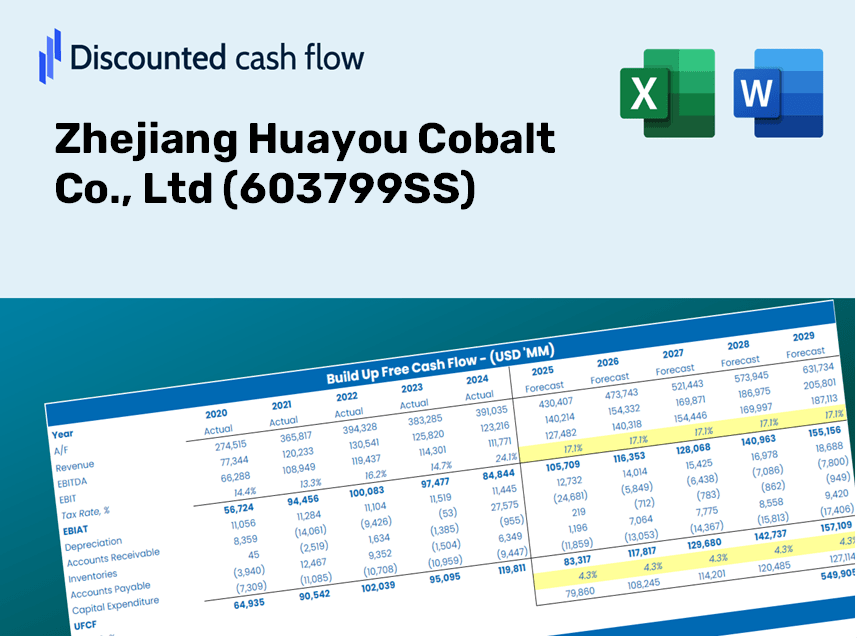
Zhejiang Huayou Cobalt Co., Ltd (603799.ss) Valoración de DCF |
Completamente Editable: Adáptelo A Sus Necesidades En Excel O Sheets
Diseño Profesional: Plantillas Confiables Y Estándares De La Industria
Predeterminadas Para Un Uso Rápido Y Eficiente
Compatible con MAC / PC, completamente desbloqueado
No Se Necesita Experiencia; Fáciles De Seguir
Zhejiang Huayou Cobalt Co., Ltd (603799.SS) Bundle
¡Descubra el verdadero valor de Zhejiang Huayou Cobalt Co., Ltd (603799SS) con nuestra calculadora DCF avanzada! Ajuste los supuestos clave, explore varios escenarios y evalúe cómo los cambios afectan la valoración de Zhejiang Huayou Cobalt Co., Ltd (603799SS), todo dentro de una plantilla de Excel fácil de usar.
Discounted Cash Flow (DCF) - (USD MM)
| Year | AY1 2020 |
AY2 2021 |
AY3 2022 |
AY4 2023 |
AY5 2024 |
FY1 2025 |
FY2 2026 |
FY3 2027 |
FY4 2028 |
FY5 2029 |
|---|---|---|---|---|---|---|---|---|---|---|
| Revenue | 21,186.8 | 35,316.5 | 63,033.8 | 66,304.0 | 60,945.6 | 82,623.8 | 112,013.1 | 151,856.0 | 205,871.1 | 279,099.3 |
| Revenue Growth, % | 0 | 66.69 | 78.48 | 5.19 | -8.08 | 35.57 | 35.57 | 35.57 | 35.57 | 35.57 |
| EBITDA | 2,568.7 | 5,870.8 | 7,868.5 | 8,297.8 | 11,014.0 | 11,867.6 | 16,088.8 | 21,811.6 | 29,570.0 | 40,088.0 |
| EBITDA, % | 12.12 | 16.62 | 12.48 | 12.51 | 18.07 | 14.36 | 14.36 | 14.36 | 14.36 | 14.36 |
| Depreciation | 743.5 | 1,071.2 | 1,870.4 | 3,317.5 | 4,514.5 | 3,622.3 | 4,910.8 | 6,657.5 | 9,025.6 | 12,236.0 |
| Depreciation, % | 3.51 | 3.03 | 2.97 | 5 | 7.41 | 4.38 | 4.38 | 4.38 | 4.38 | 4.38 |
| EBIT | 1,825.2 | 4,799.6 | 5,998.1 | 4,980.3 | 6,499.5 | 8,245.3 | 11,178.1 | 15,154.1 | 20,544.4 | 27,852.1 |
| EBIT, % | 8.61 | 13.59 | 9.52 | 7.51 | 10.66 | 9.98 | 9.98 | 9.98 | 9.98 | 9.98 |
| Total Cash | 2,364.6 | 10,102.2 | 15,687.8 | 15,633.1 | 19,833.2 | 19,957.6 | 27,056.5 | 36,680.4 | 49,727.6 | 67,415.7 |
| Total Cash, percent | .0 | .0 | .0 | .0 | .0 | .0 | .0 | .0 | .0 | .0 |
| Account Receivables | 2,608.9 | 5,702.8 | 11,055.6 | 10,402.6 | 8,505.2 | 12,500.2 | 16,946.5 | 22,974.3 | 31,146.2 | 42,224.9 |
| Account Receivables, % | 12.31 | 16.15 | 17.54 | 15.69 | 13.96 | 15.13 | 15.13 | 15.13 | 15.13 | 15.13 |
| Inventories | 4,069.2 | 9,035.0 | 17,692.0 | 15,763.4 | 17,296.8 | 20,657.9 | 28,005.8 | 37,967.5 | 51,472.5 | 69,781.2 |
| Inventories, % | 19.21 | 25.58 | 28.07 | 23.77 | 28.38 | 25 | 25 | 25 | 25 | 25 |
| Accounts Payable | 1,350.3 | 11,044.0 | 25,393.1 | 12,002.5 | 16,251.4 | 20,275.5 | 27,487.4 | 37,264.7 | 50,519.7 | 68,489.5 |
| Accounts Payable, % | 6.37 | 31.27 | 40.28 | 18.1 | 26.67 | 24.54 | 24.54 | 24.54 | 24.54 | 24.54 |
| Capital Expenditure | -3,640.5 | -6,847.2 | -16,215.0 | -16,849.2 | -6,721.6 | -16,315.9 | -22,119.5 | -29,987.4 | -40,653.8 | -55,114.4 |
| Capital Expenditure, % | -17.18 | -19.39 | -25.72 | -25.41 | -11.03 | -19.75 | -19.75 | -19.75 | -19.75 | -19.75 |
| Tax Rate, % | 25.6 | 25.6 | 25.6 | 25.6 | 25.6 | 25.6 | 25.6 | 25.6 | 25.6 | 25.6 |
| EBITAT | 1,437.8 | 3,874.3 | 3,888.4 | 3,495.7 | 4,835.5 | 6,083.5 | 8,247.4 | 11,181.1 | 15,158.1 | 20,549.9 |
| Depreciation | ||||||||||
| Changes in Account Receivables | ||||||||||
| Changes in Inventories | ||||||||||
| Changes in Accounts Payable | ||||||||||
| Capital Expenditure | ||||||||||
| UFCF | -6,786.9 | -267.8 | -10,116.9 | -20,845.0 | 7,241.2 | -9,942.0 | -13,543.6 | -18,361.0 | -24,892.0 | -33,746.1 |
| WACC, % | 8.73 | 8.76 | 8.51 | 8.59 | 8.66 | 8.65 | 8.65 | 8.65 | 8.65 | 8.65 |
| PV UFCF | ||||||||||
| SUM PV UFCF | -75,087.7 | |||||||||
| Long Term Growth Rate, % | 3.50 | |||||||||
| Free cash flow (T + 1) | -34,927 | |||||||||
| Terminal Value | -678,089 | |||||||||
| Present Terminal Value | -447,839 | |||||||||
| Enterprise Value | -522,926 | |||||||||
| Net Debt | 27,770 | |||||||||
| Equity Value | -550,697 | |||||||||
| Diluted Shares Outstanding, MM | 1,738 | |||||||||
| Equity Value Per Share | -316.78 |
What You Will Receive
- Customizable Excel Template: A fully adjustable Excel-based DCF Calculator featuring pre-filled financial data for Zhejiang Huayou Cobalt Co., Ltd (603799SS).
- Authentic Data: Historical figures and forward-looking projections (highlighted in the yellow cells).
- Assumption Flexibility: Modify forecast parameters such as revenue growth, EBITDA percentage, and WACC.
- Instant Calculations: Quickly observe how your inputs affect the valuation of Zhejiang Huayou Cobalt Co., Ltd (603799SS).
- Professional Resource: Designed for investors, CFOs, consultants, and financial analysts.
- User-Centric Design: Organized for clarity and simplicity, complete with step-by-step guidance.
Key Features
- Real-Time 603799SS Data: Pre-loaded with Zhejiang Huayou Cobalt's historical financials and future projections.
- Fully Customizable Parameters: Modify revenue growth, profit margins, WACC, tax rates, and capital expenditures.
- Adaptive Valuation Model: Instant updates to Net Present Value (NPV) and intrinsic value based on your personalized inputs.
- Scenario Analysis: Develop various forecast scenarios to explore different valuation results.
- User-Friendly Interface: Intuitive, organized, and tailored for both professionals and novices.
How It Functions
- Download the Template: Gain immediate access to the Excel-based Huayou Cobalt DCF Calculator.
- Input Your Assumptions: Modify the yellow-highlighted cells to enter growth rates, WACC, margins, and more.
- Instant Calculations: The model automatically recalculates the intrinsic value of Zhejiang Huayou Cobalt Co., Ltd (603799SS).
- Test Scenarios: Experiment with various assumptions to assess potential valuation shifts.
- Analyze and Decide: Leverage the results to inform your investment or financial analysis.
Why Use This Calculator for Zhejiang Huayou Cobalt Co., Ltd (603799SS)?
- All-in-One Solution: Offers DCF, WACC, and comprehensive financial ratio analyses in a single tool.
- Flexible Inputs: Modify the highlighted cells to explore different financial scenarios.
- In-Depth Analysis: Automatically computes the intrinsic value and Net Present Value for Zhejiang Huayou Cobalt Co., Ltd (603799SS).
- Integrated Data: Features both historical and projected data for precise analysis.
- High-Quality Standards: Perfect for financial analysts, investors, and business advisors.
Who Should Use This Product?
- Individual Investors: Gain valuable insights for making informed decisions on purchasing or selling shares of Zhejiang Huayou Cobalt Co., Ltd (603799SS).
- Financial Analysts: Enhance your valuation accuracy with comprehensive financial models specifically designed for Zhejiang Huayou Cobalt Co., Ltd (603799SS).
- Consultants: Provide clients with precise and timely valuation assessments related to Zhejiang Huayou Cobalt Co., Ltd (603799SS).
- Business Owners: Learn from the valuation strategies of major companies like Zhejiang Huayou Cobalt Co., Ltd (603799SS) to inform your own business approach.
- Finance Students: Explore practical valuation methods using real data and case studies involving Zhejiang Huayou Cobalt Co., Ltd (603799SS).
Contents of the Template
- Operating and Balance Sheet Data: Pre-filled historical data and forecasts for Zhejiang Huayou Cobalt Co., Ltd (603799SS), including revenue, EBITDA, EBIT, and capital expenditures.
- WACC Calculation: A specific sheet for calculating the Weighted Average Cost of Capital (WACC), featuring parameters such as Beta, risk-free rate, and share price.
- DCF Valuation (Unlevered and Levered): Customizable Discounted Cash Flow models that illustrate intrinsic value along with comprehensive calculations.
- Financial Statements: Pre-loaded financial statements (annual and quarterly) to facilitate thorough analysis.
- Key Ratios: Includes key financial ratios pertaining to profitability, leverage, and efficiency for Zhejiang Huayou Cobalt Co., Ltd (603799SS).
- Dashboard and Charts: A visual overview of valuation outputs and assumptions, designed for easy interpretation of results.
Disclaimer
All information, articles, and product details provided on this website are for general informational and educational purposes only. We do not claim any ownership over, nor do we intend to infringe upon, any trademarks, copyrights, logos, brand names, or other intellectual property mentioned or depicted on this site. Such intellectual property remains the property of its respective owners, and any references here are made solely for identification or informational purposes, without implying any affiliation, endorsement, or partnership.
We make no representations or warranties, express or implied, regarding the accuracy, completeness, or suitability of any content or products presented. Nothing on this website should be construed as legal, tax, investment, financial, medical, or other professional advice. In addition, no part of this site—including articles or product references—constitutes a solicitation, recommendation, endorsement, advertisement, or offer to buy or sell any securities, franchises, or other financial instruments, particularly in jurisdictions where such activity would be unlawful.
All content is of a general nature and may not address the specific circumstances of any individual or entity. It is not a substitute for professional advice or services. Any actions you take based on the information provided here are strictly at your own risk. You accept full responsibility for any decisions or outcomes arising from your use of this website and agree to release us from any liability in connection with your use of, or reliance upon, the content or products found herein.