
|
Nancal Technology Co., Ltd (603859.ss) Valoración de DCF |
Completamente Editable: Adáptelo A Sus Necesidades En Excel O Sheets
Diseño Profesional: Plantillas Confiables Y Estándares De La Industria
Predeterminadas Para Un Uso Rápido Y Eficiente
Compatible con MAC / PC, completamente desbloqueado
No Se Necesita Experiencia; Fáciles De Seguir
Nancal Technology Co.,Ltd (603859.SS) Bundle
¡Descubra el verdadero potencial de Nancal Technology Co., LTD (603859SS) con nuestra calculadora DCF avanzada! Ajuste los supuestos clave, explore varios escenarios y evalúe los efectos de los cambios en Nancal Technology Co., Valoración LTD (603859SS): todo dentro de una conveniente plantilla de Excel.
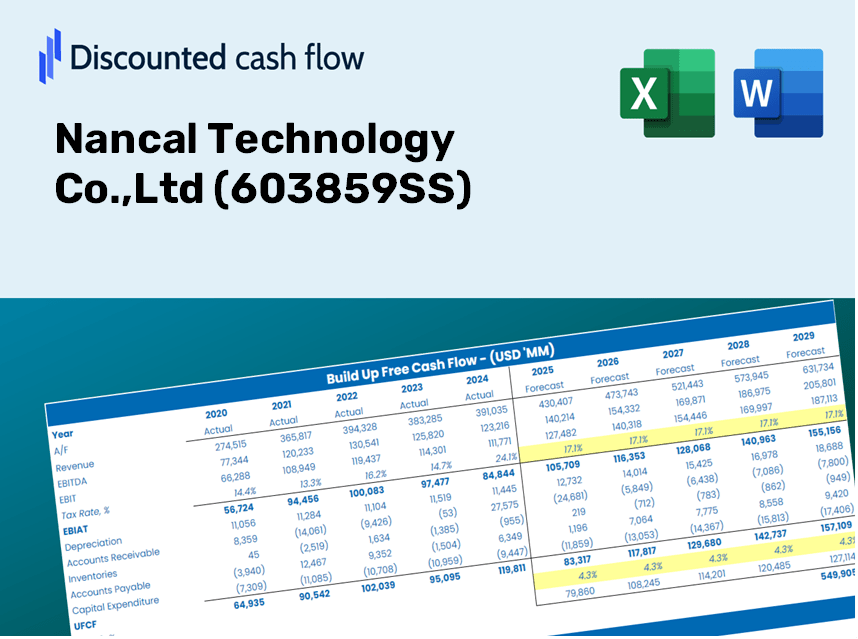
Discounted Cash Flow (DCF) - (USD MM)
| Year | AY1 2020 |
AY2 2021 |
AY3 2022 |
AY4 2023 |
AY5 2024 |
FY1 2025 |
FY2 2026 |
FY3 2027 |
FY4 2028 |
FY5 2029 |
|---|---|---|---|---|---|---|---|---|---|---|
| Revenue | 951.9 | 1,140.9 | 1,235.5 | 1,404.8 | 1,509.8 | 1,696.0 | 1,905.1 | 2,140.1 | 2,404.0 | 2,700.4 |
| Revenue Growth, % | 0 | 19.85 | 8.29 | 13.71 | 7.47 | 12.33 | 12.33 | 12.33 | 12.33 | 12.33 |
| EBITDA | 176.4 | 260.2 | 296.4 | 392.2 | 383.2 | 402.4 | 452.0 | 507.8 | 570.4 | 640.7 |
| EBITDA, % | 18.53 | 22.81 | 23.99 | 27.92 | 25.38 | 23.73 | 23.73 | 23.73 | 23.73 | 23.73 |
| Depreciation | 32.2 | 71.2 | 79.2 | 70.9 | 94.8 | 92.8 | 104.2 | 117.1 | 131.5 | 147.7 |
| Depreciation, % | 3.38 | 6.24 | 6.41 | 5.05 | 6.28 | 5.47 | 5.47 | 5.47 | 5.47 | 5.47 |
| EBIT | 144.2 | 189.1 | 217.2 | 321.3 | 288.5 | 309.6 | 347.8 | 390.7 | 438.9 | 493.0 |
| EBIT, % | 15.14 | 16.57 | 17.58 | 22.87 | 19.11 | 18.26 | 18.26 | 18.26 | 18.26 | 18.26 |
| Total Cash | 225.0 | 774.7 | 492.2 | 447.4 | 660.4 | 702.1 | 788.6 | 885.9 | 995.1 | 1,117.8 |
| Total Cash, percent | .0 | .0 | .0 | .0 | .0 | .0 | .0 | .0 | .0 | .0 |
| Account Receivables | 756.3 | 919.2 | 1,248.3 | 1,487.2 | 1,590.3 | 1,560.4 | 1,752.8 | 1,969.0 | 2,211.8 | 2,484.5 |
| Account Receivables, % | 79.45 | 80.57 | 101.04 | 105.86 | 105.33 | 92.01 | 92.01 | 92.01 | 92.01 | 92.01 |
| Inventories | 143.1 | 154.8 | 110.8 | 154.0 | 211.1 | 212.1 | 238.2 | 267.6 | 300.6 | 337.6 |
| Inventories, % | 15.03 | 13.57 | 8.97 | 10.97 | 13.98 | 12.5 | 12.5 | 12.5 | 12.5 | 12.5 |
| Accounts Payable | 244.6 | 247.0 | 282.9 | 517.4 | 565.7 | 490.3 | 550.8 | 618.7 | 695.0 | 780.7 |
| Accounts Payable, % | 25.7 | 21.65 | 22.9 | 36.83 | 37.47 | 28.91 | 28.91 | 28.91 | 28.91 | 28.91 |
| Capital Expenditure | -235.1 | -223.8 | -334.1 | -333.0 | -317.8 | -393.9 | -442.4 | -497.0 | -558.3 | -627.1 |
| Capital Expenditure, % | -24.7 | -19.62 | -27.05 | -23.71 | -21.05 | -23.22 | -23.22 | -23.22 | -23.22 | -23.22 |
| Tax Rate, % | 38.77 | 38.77 | 38.77 | 38.77 | 38.77 | 38.77 | 38.77 | 38.77 | 38.77 | 38.77 |
| EBITAT | 128.1 | 165.3 | 179.5 | 219.5 | 176.6 | 240.5 | 270.2 | 303.5 | 340.9 | 383.0 |
| Depreciation | ||||||||||
| Changes in Account Receivables | ||||||||||
| Changes in Inventories | ||||||||||
| Changes in Accounts Payable | ||||||||||
| Capital Expenditure | ||||||||||
| UFCF | -729.6 | -159.6 | -324.6 | -90.3 | -158.1 | -107.1 | -226.1 | -254.0 | -285.3 | -320.5 |
| WACC, % | 5.08 | 5.08 | 5.08 | 5.06 | 5.06 | 5.07 | 5.07 | 5.07 | 5.07 | 5.07 |
| PV UFCF | ||||||||||
| SUM PV UFCF | -1,010.1 | |||||||||
| Long Term Growth Rate, % | 4.00 | |||||||||
| Free cash flow (T + 1) | -333 | |||||||||
| Terminal Value | -31,079 | |||||||||
| Present Terminal Value | -24,268 | |||||||||
| Enterprise Value | -25,278 | |||||||||
| Net Debt | -300 | |||||||||
| Equity Value | -24,978 | |||||||||
| Diluted Shares Outstanding, MM | 246 | |||||||||
| Equity Value Per Share | -101.61 |
What You Will Receive
- Pre-Filled Financial Model: Nancal Technology Co., Ltd's actual data allows for accurate DCF valuation.
- Comprehensive Forecast Control: Modify revenue growth, profit margins, WACC, and other critical factors.
- Real-Time Calculations: Automatic updates provide immediate results as adjustments are made.
- Investor-Ready Template: A polished Excel document crafted for high-quality valuation presentations.
- Flexible and Reusable: Designed for adaptability, enabling repeated use for thorough forecasting.
Key Features
- Customizable Forecast Inputs: Adjust essential variables like revenue growth, EBITDA %, and capital expenditures.
- Instant DCF Valuation: Automatically computes intrinsic value, NPV, and other metrics with ease.
- High-Precision Accuracy: Leverages real-world financial data from Nancal Technology Co., Ltd (603859SS) for reliable valuation results.
- Streamlined Scenario Analysis: Effortlessly evaluate various assumptions and analyze different outcomes.
- Efficiency Booster: Removes the hassle of constructing intricate valuation models from the ground up.
How It Functions
- Download: Obtain the pre-prepared Excel file featuring Nancal Technology Co., Ltd's (603859SS) financial data.
- Customize: Modify forecasts such as revenue growth, EBITDA percentage, and WACC.
- Update Automatically: Watch as intrinsic value and NPV calculations refresh in real-time.
- Test Scenarios: Generate various projections and instantly compare the results.
- Make Decisions: Leverage the valuation outcomes to inform your investment strategy.
Why Choose Nancal Technology Co., Ltd (603859SS) Calculator?
- Save Time: Skip the hassle of building a discounted cash flow model from the ground up – it’s ready for immediate use.
- Enhance Precision: Accurate financial data and established formulas help minimize valuation errors.
- Completely Customizable: Adjust the model to mirror your unique assumptions and forecasts.
- User-Friendly: Intuitive charts and outputs simplify the analysis of results.
- Endorsed by Professionals: Crafted for experts who prioritize both accuracy and functionality.
Who Is This Product Ideal For?
- Professional Investors: Create comprehensive and accurate valuation models for analyzing portfolios with Nancal Technology Co., Ltd (603859SS).
- Corporate Finance Teams: Evaluate valuation scenarios to inform strategic decisions within the organization.
- Consultants and Advisors: Deliver precise valuation insights to clients focusing on Nancal Technology Co., Ltd (603859SS).
- Students and Educators: Leverage real-world data to practice and educate on financial modeling techniques.
- Tech Enthusiasts: Gain insights into how technology companies like Nancal Technology Co., Ltd (603859SS) are valued in the marketplace.
Contents of the Template
- Preloaded Nancal Technology Data: Historical and projected financial metrics, including revenue, EBIT, and capital expenditures.
- DCF and WACC Models: Advanced sheets designed for calculating intrinsic value and Weighted Average Cost of Capital.
- Editable Inputs: Yellow-highlighted cells for key adjustments, such as revenue growth, tax rates, and discount rates.
- Financial Statements: Detailed annual and quarterly financial reports for in-depth analysis.
- Key Ratios: Profitability, leverage, and efficiency ratios to assess performance.
- Dashboard and Charts: Visual representations of valuation results and underlying assumptions.
Disclaimer
All information, articles, and product details provided on this website are for general informational and educational purposes only. We do not claim any ownership over, nor do we intend to infringe upon, any trademarks, copyrights, logos, brand names, or other intellectual property mentioned or depicted on this site. Such intellectual property remains the property of its respective owners, and any references here are made solely for identification or informational purposes, without implying any affiliation, endorsement, or partnership.
We make no representations or warranties, express or implied, regarding the accuracy, completeness, or suitability of any content or products presented. Nothing on this website should be construed as legal, tax, investment, financial, medical, or other professional advice. In addition, no part of this site—including articles or product references—constitutes a solicitation, recommendation, endorsement, advertisement, or offer to buy or sell any securities, franchises, or other financial instruments, particularly in jurisdictions where such activity would be unlawful.
All content is of a general nature and may not address the specific circumstances of any individual or entity. It is not a substitute for professional advice or services. Any actions you take based on the information provided here are strictly at your own risk. You accept full responsibility for any decisions or outcomes arising from your use of this website and agree to release us from any liability in connection with your use of, or reliance upon, the content or products found herein.