
|
Ningbo PeaceBird Fashion Co., Ltd. (603877.ss) Valoración de DCF |
Completamente Editable: Adáptelo A Sus Necesidades En Excel O Sheets
Diseño Profesional: Plantillas Confiables Y Estándares De La Industria
Predeterminadas Para Un Uso Rápido Y Eficiente
Compatible con MAC / PC, completamente desbloqueado
No Se Necesita Experiencia; Fáciles De Seguir
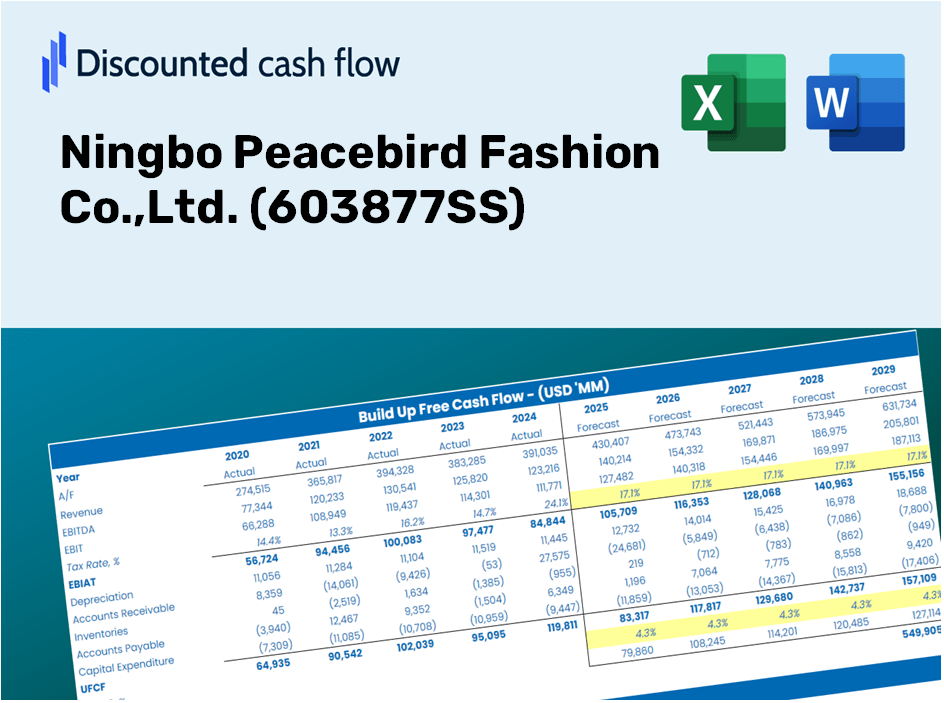
Ningbo Peacebird Fashion Co.,Ltd. (603877.SS) Bundle
¡Explore las perspectivas financieras de Ningbo PeaceBird Fashion Co., Ltd. (603877SS) utilizando nuestra calculadora DCF fácil de usar! Ingrese sus suposiciones para el crecimiento, los márgenes y los costos para determinar el valor intrínseco de Ningbo PeaceBird Fashion Co., Ltd. (603877ss) y mejorar su estrategia de inversión.
Discounted Cash Flow (DCF) - (USD MM)
| Year | AY1 2020 |
AY2 2021 |
AY3 2022 |
AY4 2023 |
AY5 2024 |
FY1 2025 |
FY2 2026 |
FY3 2027 |
FY4 2028 |
FY5 2029 |
|---|---|---|---|---|---|---|---|---|---|---|
| Revenue | 9,386.9 | 10,920.8 | 8,601.6 | 7,792.1 | 6,802.4 | 6,343.1 | 5,914.8 | 5,515.5 | 5,143.1 | 4,795.8 |
| Revenue Growth, % | 0 | 16.34 | -21.24 | -9.41 | -12.7 | -6.75 | -6.75 | -6.75 | -6.75 | -6.75 |
| EBITDA | 860.2 | 910.4 | 181.4 | 607.1 | 383.0 | 419.0 | 390.7 | 364.4 | 339.8 | 316.8 |
| EBITDA, % | 9.16 | 8.34 | 2.11 | 7.79 | 5.63 | 6.61 | 6.61 | 6.61 | 6.61 | 6.61 |
| Depreciation | 92.7 | 116.3 | 123.1 | 130.9 | 114.6 | 86.9 | 81.0 | 75.5 | 70.4 | 65.7 |
| Depreciation, % | 0.98751 | 1.06 | 1.43 | 1.68 | 1.68 | 1.37 | 1.37 | 1.37 | 1.37 | 1.37 |
| EBIT | 767.5 | 794.1 | 58.3 | 476.3 | 268.4 | 332.2 | 309.7 | 288.8 | 269.3 | 251.1 |
| EBIT, % | 8.18 | 7.27 | 0.67816 | 6.11 | 3.95 | 5.24 | 5.24 | 5.24 | 5.24 | 5.24 |
| Total Cash | 2,532.0 | 3,204.2 | 2,351.0 | 2,797.3 | 2,515.3 | 1,985.7 | 1,851.6 | 1,726.6 | 1,610.0 | 1,501.3 |
| Total Cash, percent | .0 | .0 | .0 | .0 | .0 | .0 | .0 | .0 | .0 | .0 |
| Account Receivables | 929.7 | 803.2 | 662.7 | 486.1 | 625.7 | 512.5 | 477.9 | 445.6 | 415.6 | 387.5 |
| Account Receivables, % | 9.9 | 7.35 | 7.7 | 6.24 | 9.2 | 8.08 | 8.08 | 8.08 | 8.08 | 8.08 |
| Inventories | 2,256.6 | 2,540.0 | 2,124.7 | 1,508.6 | 1,735.6 | 1,482.7 | 1,382.6 | 1,289.2 | 1,202.2 | 1,121.0 |
| Inventories, % | 24.04 | 23.26 | 24.7 | 19.36 | 25.51 | 23.38 | 23.38 | 23.38 | 23.38 | 23.38 |
| Accounts Payable | 2,390.9 | 2,467.6 | 1,630.5 | 825.2 | 1,294.6 | 1,226.0 | 1,143.3 | 1,066.1 | 994.1 | 927.0 |
| Accounts Payable, % | 25.47 | 22.6 | 18.96 | 10.59 | 19.03 | 19.33 | 19.33 | 19.33 | 19.33 | 19.33 |
| Capital Expenditure | -391.4 | -366.3 | -248.1 | -250.0 | -362.6 | -240.4 | -224.1 | -209.0 | -194.9 | -181.7 |
| Capital Expenditure, % | -4.17 | -3.35 | -2.88 | -3.21 | -5.33 | -3.79 | -3.79 | -3.79 | -3.79 | -3.79 |
| Tax Rate, % | 31.82 | 31.82 | 31.82 | 31.82 | 31.82 | 31.82 | 31.82 | 31.82 | 31.82 | 31.82 |
| EBITAT | 603.5 | 566.5 | 41.4 | 346.0 | 183.0 | 240.4 | 224.2 | 209.0 | 194.9 | 181.7 |
| Depreciation | ||||||||||
| Changes in Account Receivables | ||||||||||
| Changes in Inventories | ||||||||||
| Changes in Accounts Payable | ||||||||||
| Capital Expenditure | ||||||||||
| UFCF | -490.5 | 236.2 | -364.8 | 214.2 | 37.7 | 384.4 | 132.9 | 124.0 | 115.6 | 107.8 |
| WACC, % | 4.77 | 4.71 | 4.7 | 4.72 | 4.68 | 4.72 | 4.72 | 4.72 | 4.72 | 4.72 |
| PV UFCF | ||||||||||
| SUM PV UFCF | 778.1 | |||||||||
| Long Term Growth Rate, % | 3.50 | |||||||||
| Free cash flow (T + 1) | 112 | |||||||||
| Terminal Value | 9,174 | |||||||||
| Present Terminal Value | 7,286 | |||||||||
| Enterprise Value | 8,064 | |||||||||
| Net Debt | 313 | |||||||||
| Equity Value | 7,750 | |||||||||
| Diluted Shares Outstanding, MM | 469 | |||||||||
| Equity Value Per Share | 16.51 |
What You'll Receive
- Authentic 603877SS Financial Data: Pre-populated with Ningbo Peacebird Fashion Co., Ltd.'s historical and forecasted metrics for accurate analysis.
- Customizable Template: Easily adjust key variables such as revenue growth, discount rates, and profit margins.
- Instant Calculations: Watch as the intrinsic value of Ningbo Peacebird updates immediately with your modifications.
- Professional Valuation Tool: Tailored for investors, analysts, and consultants looking for reliable DCF outcomes.
- User-Friendly Interface: Clear layout and straightforward instructions suitable for users of all skill levels.
Key Features
- Real-Time Ningbo Peacebird Data: Pre-loaded with the historical financial data and future projections for Ningbo Peacebird Fashion Co., Ltd. (603877SS).
- Completely Customizable Inputs: Tailor revenue growth, profit margins, weighted average cost of capital (WACC), tax rates, and investment expenditures.
- Adaptive Valuation Model: Instantly refreshes Net Present Value (NPV) and intrinsic value according to your specified parameters.
- Scenario Analysis: Develop various forecasting scenarios to evaluate different valuation results.
- Intuitive User Interface: Designed to be straightforward and accessible for both seasoned professionals and newcomers.
Our Process
- Download the Template: Gain immediate access to the Excel-based Ningbo Peacebird Fashion DCF Calculator.
- Input Your Assumptions: Modify the yellow-highlighted cells for growth rates, WACC, profit margins, and other variables.
- Instant Calculations: The model will automatically refresh to display Ningbo Peacebird's intrinsic value.
- Test Scenarios: Experiment with various assumptions to assess possible changes in valuation.
- Analyze and Decide: Leverage the outcomes to inform your investment or financial strategy.
Why Opt for Ningbo Peacebird Fashion Co.,Ltd. (603877SS)?
- All-in-One Solution: Offers a comprehensive analysis covering market trends, financial performance, and investment potential.
- Flexible Options: Modify highlighted fields to explore different market scenarios and outcomes.
- In-Depth Analysis: Provides detailed insights into Ningbo Peacebird’s market position and growth forecasts.
- Data-Rich Environment: Utilizes historical and projected data for reliable starting points in your evaluation.
- Expert-Level Insights: Tailored for investors, analysts, and industry consultants looking for professional-grade evaluations.
Who Can Benefit from This Product?
- Fashion Industry Investors: Develop comprehensive and accurate valuation models for evaluating investment opportunities in Ningbo Peacebird Fashion Co., Ltd. (603877SS).
- Corporate Strategy Teams: Assess valuation scenarios to inform company growth and strategic initiatives.
- Financial Consultants and Advisors: Deliver precise valuation insights to clients interested in Ningbo Peacebird Fashion Co., Ltd. (603877SS).
- Students and Educators: Utilize real market data to enhance learning and practice in financial modeling.
- Fashion Enthusiasts: Gain insights into the market valuation of fashion companies like Ningbo Peacebird Fashion Co., Ltd. (603877SS).
Contents of the Template
- Historical Data: Encompasses Ningbo Peacebird Fashion Co., Ltd.’s past financial performance and baseline projections.
- DCF and Levered DCF Models: Comprehensive templates designed to assess the intrinsic value of Ningbo Peacebird Fashion Co., Ltd. (603877SS).
- WACC Sheet: Pre-calculated figures for the Weighted Average Cost of Capital.
- Editable Inputs: Adjust critical variables such as growth rates, EBITDA percentages, and capital expenditure assumptions.
- Quarterly and Annual Statements: An in-depth analysis of Ningbo Peacebird Fashion Co., Ltd.’s financial data.
- Interactive Dashboard: Dynamically visualize valuation results and future projections.
Disclaimer
All information, articles, and product details provided on this website are for general informational and educational purposes only. We do not claim any ownership over, nor do we intend to infringe upon, any trademarks, copyrights, logos, brand names, or other intellectual property mentioned or depicted on this site. Such intellectual property remains the property of its respective owners, and any references here are made solely for identification or informational purposes, without implying any affiliation, endorsement, or partnership.
We make no representations or warranties, express or implied, regarding the accuracy, completeness, or suitability of any content or products presented. Nothing on this website should be construed as legal, tax, investment, financial, medical, or other professional advice. In addition, no part of this site—including articles or product references—constitutes a solicitation, recommendation, endorsement, advertisement, or offer to buy or sell any securities, franchises, or other financial instruments, particularly in jurisdictions where such activity would be unlawful.
All content is of a general nature and may not address the specific circumstances of any individual or entity. It is not a substitute for professional advice or services. Any actions you take based on the information provided here are strictly at your own risk. You accept full responsibility for any decisions or outcomes arising from your use of this website and agree to release us from any liability in connection with your use of, or reliance upon, the content or products found herein.