
|
Guangzhou Kingmed Diagnostics Group Co., Ltd. (603882.ss) Valoración de DCF |
Completamente Editable: Adáptelo A Sus Necesidades En Excel O Sheets
Diseño Profesional: Plantillas Confiables Y Estándares De La Industria
Predeterminadas Para Un Uso Rápido Y Eficiente
Compatible con MAC / PC, completamente desbloqueado
No Se Necesita Experiencia; Fáciles De Seguir
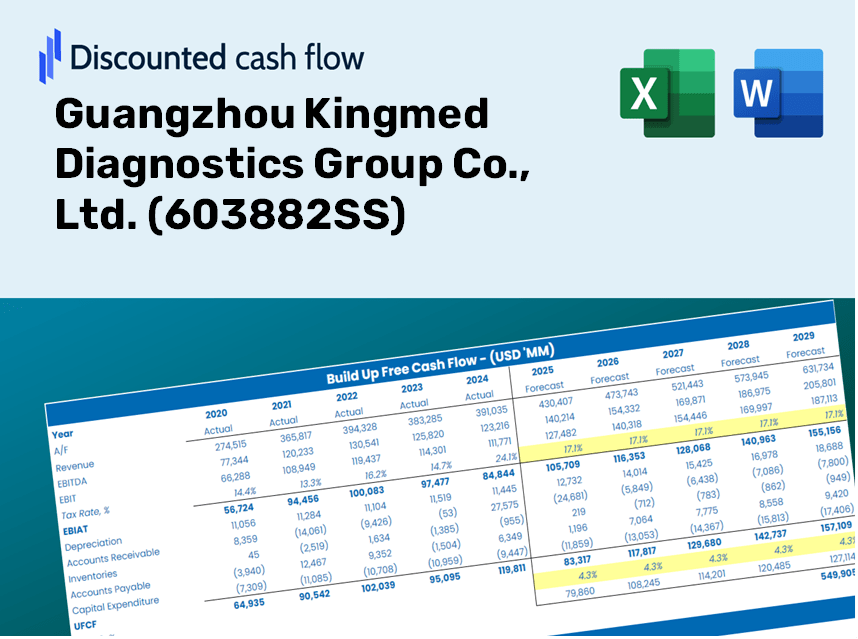
Guangzhou Kingmed Diagnostics Group Co., Ltd. (603882.SS) Bundle
¡Optimice su tiempo y mejore la precisión con nuestra calculadora DCF (603882SS)! Utilizando datos auténticos de Guangzhou Kingmed Diagnostics Group Co., Ltd. y suposiciones personalizables, esta herramienta le permite pronosticar, analizar y evaluar (603882SS) como un inversor experimentado.
Discounted Cash Flow (DCF) - (USD MM)
| Year | AY1 2020 |
AY2 2021 |
AY3 2022 |
AY4 2023 |
AY5 2024 |
FY1 2025 |
FY2 2026 |
FY3 2027 |
FY4 2028 |
FY5 2029 |
|---|---|---|---|---|---|---|---|---|---|---|
| Revenue | 8,243.8 | 11,943.2 | 15,476.1 | 8,539.6 | 7,189.5 | 7,451.5 | 7,723.1 | 8,004.5 | 8,296.2 | 8,598.5 |
| Revenue Growth, % | 0 | 44.88 | 29.58 | -44.82 | -15.81 | 3.64 | 3.64 | 3.64 | 3.64 | 3.64 |
| EBITDA | 2,065.9 | 3,055.7 | 3,678.8 | 866.7 | 257.9 | 1,313.7 | 1,361.6 | 1,411.2 | 1,462.6 | 1,515.9 |
| EBITDA, % | 25.06 | 25.58 | 23.77 | 10.15 | 3.59 | 17.63 | 17.63 | 17.63 | 17.63 | 17.63 |
| Depreciation | 280.9 | 331.6 | 412.8 | 451.7 | 438.8 | 301.7 | 312.7 | 324.1 | 335.9 | 348.1 |
| Depreciation, % | 3.41 | 2.78 | 2.67 | 5.29 | 6.1 | 4.05 | 4.05 | 4.05 | 4.05 | 4.05 |
| EBIT | 1,785.0 | 2,724.1 | 3,265.9 | 414.9 | -180.9 | 1,012.0 | 1,048.9 | 1,087.1 | 1,126.7 | 1,167.8 |
| EBIT, % | 21.65 | 22.81 | 21.1 | 4.86 | -2.52 | 13.58 | 13.58 | 13.58 | 13.58 | 13.58 |
| Total Cash | 1,635.3 | 2,653.4 | 2,928.7 | 2,457.7 | 2,433.6 | 1,842.1 | 1,909.2 | 1,978.8 | 2,050.9 | 2,125.7 |
| Total Cash, percent | .0 | .0 | .0 | .0 | .0 | .0 | .0 | .0 | .0 | .0 |
| Account Receivables | 2,771.3 | 4,803.8 | 7,237.3 | 5,476.3 | 4,511.9 | 3,688.3 | 3,822.7 | 3,962.0 | 4,106.4 | 4,256.1 |
| Account Receivables, % | 33.62 | 40.22 | 46.76 | 64.13 | 62.76 | 49.5 | 49.5 | 49.5 | 49.5 | 49.5 |
| Inventories | 238.1 | 345.1 | 405.3 | 248.2 | 198.3 | 209.6 | 217.2 | 225.1 | 233.3 | 241.8 |
| Inventories, % | 2.89 | 2.89 | 2.62 | 2.91 | 2.76 | 2.81 | 2.81 | 2.81 | 2.81 | 2.81 |
| Accounts Payable | 1,626.5 | 2,282.8 | 2,988.2 | 2,065.1 | 1,716.1 | 1,582.8 | 1,640.5 | 1,700.2 | 1,762.2 | 1,826.4 |
| Accounts Payable, % | 19.73 | 19.11 | 19.31 | 24.18 | 23.87 | 21.24 | 21.24 | 21.24 | 21.24 | 21.24 |
| Capital Expenditure | -550.7 | -952.4 | -840.5 | -714.7 | -446.4 | -516.6 | -535.4 | -554.9 | -575.2 | -596.1 |
| Capital Expenditure, % | -6.68 | -7.97 | -5.43 | -8.37 | -6.21 | -6.93 | -6.93 | -6.93 | -6.93 | -6.93 |
| Tax Rate, % | 13.09 | 13.09 | 13.09 | 13.09 | 13.09 | 13.09 | 13.09 | 13.09 | 13.09 | 13.09 |
| EBITAT | 1,488.5 | 2,200.7 | 2,709.3 | 360.6 | -157.2 | 852.0 | 883.1 | 915.3 | 948.6 | 983.2 |
| Depreciation | ||||||||||
| Changes in Account Receivables | ||||||||||
| Changes in Inventories | ||||||||||
| Changes in Accounts Payable | ||||||||||
| Capital Expenditure | ||||||||||
| UFCF | -164.2 | 96.5 | 493.5 | 1,092.5 | 500.5 | 1,316.1 | 576.0 | 597.0 | 618.7 | 641.3 |
| WACC, % | 9.64 | 9.63 | 9.64 | 9.64 | 9.64 | 9.64 | 9.64 | 9.64 | 9.64 | 9.64 |
| PV UFCF | ||||||||||
| SUM PV UFCF | 2,965.3 | |||||||||
| Long Term Growth Rate, % | 2.00 | |||||||||
| Free cash flow (T + 1) | 654 | |||||||||
| Terminal Value | 8,561 | |||||||||
| Present Terminal Value | 5,403 | |||||||||
| Enterprise Value | 8,369 | |||||||||
| Net Debt | -1,799 | |||||||||
| Equity Value | 10,168 | |||||||||
| Diluted Shares Outstanding, MM | 465 | |||||||||
| Equity Value Per Share | 21.87 |
What You Will Receive
- Authentic Kingmed Financial Data: Pre-filled with Guangzhou Kingmed Diagnostics Group Co., Ltd.‘s historical and projected data for accurate analysis.
- Completely Customizable Template: Easily adjust key inputs such as revenue growth, WACC, and EBITDA percentage.
- Instant Calculations: Watch the intrinsic value of Kingmed update in real-time as you make changes.
- Expert Valuation Tool: Tailored for investors, analysts, and consultants in need of precise DCF results.
- User-Friendly Layout: Intuitive structure and clear guidelines suitable for all skill levels.
Key Features
- Real-Time Kingmed Data: Pre-filled with Guangzhou Kingmed Diagnostics Group Co., Ltd.'s historical financials and future projections.
- Fully Customizable Parameters: Modify revenue growth rates, profit margins, WACC, tax rates, and capital investments.
- Dynamic Valuation Framework: Automatic recalculation of Net Present Value (NPV) and intrinsic value based on your specified inputs.
- Scenario Analysis: Develop multiple forecasting scenarios to assess various valuation outcomes.
- User-Friendly Interface: Intuitive, well-structured, catering to both professionals and beginners.
How It Functions
- Download: Obtain the pre-prepared Excel file containing financial data for Guangzhou Kingmed Diagnostics Group Co., Ltd. (603882SS).
- Customize: Modify forecasts such as revenue growth, EBITDA %, and WACC to fit your analysis.
- Real-Time Updates: The intrinsic value and NPV calculations refresh automatically as you make changes.
- Scenario Testing: Generate various projections and instantly assess different outcomes.
- Informed Decisions: Leverage the valuation insights to shape your investment approach.
Why Opt for This Calculator?
- Precise Information: Utilize real financial data from Guangzhou Kingmed Diagnostics Group Co., Ltd. to achieve trustworthy valuation outcomes.
- Flexible Settings: Tailor key metrics such as growth rates, WACC, and tax rates to align with your forecasts.
- Efficiency: Pre-configured calculations save you the hassle of starting from scratch.
- Expert-Level Tool: Crafted for investors, analysts, and consultants alike.
- Intuitive Interface: User-friendly design and clear instructions make it accessible for everyone.
Who Can Benefit from This Product?
- Investors: Effectively assess the fair value of Guangzhou Kingmed Diagnostics Group Co., Ltd. (603882SS) prior to making investment choices.
- CFOs: Utilize a high-quality DCF model for comprehensive financial analysis and reporting.
- Consultants: Efficiently customize the template for client valuation reports.
- Entrepreneurs: Acquire knowledge of financial modeling practices employed by leading companies.
- Educators: Serve as a valuable resource for teaching valuation techniques and methodologies.
Contents of the Template
- Preloaded Kingmed Data: Historical and projected financial metrics, including revenue, EBIT, and capital expenditures.
- DCF and WACC Models: Professional-grade templates for determining intrinsic value and Weighted Average Cost of Capital.
- Editable Inputs: Yellow-highlighted fields for modifying revenue growth, tax rates, and discount rates.
- Financial Statements: Detailed annual and quarterly financial reports for in-depth analysis.
- Key Ratios: Ratios for profitability, leverage, and efficiency to assess performance.
- Dashboard and Charts: Visual representations of valuation results and underlying assumptions.
Disclaimer
All information, articles, and product details provided on this website are for general informational and educational purposes only. We do not claim any ownership over, nor do we intend to infringe upon, any trademarks, copyrights, logos, brand names, or other intellectual property mentioned or depicted on this site. Such intellectual property remains the property of its respective owners, and any references here are made solely for identification or informational purposes, without implying any affiliation, endorsement, or partnership.
We make no representations or warranties, express or implied, regarding the accuracy, completeness, or suitability of any content or products presented. Nothing on this website should be construed as legal, tax, investment, financial, medical, or other professional advice. In addition, no part of this site—including articles or product references—constitutes a solicitation, recommendation, endorsement, advertisement, or offer to buy or sell any securities, franchises, or other financial instruments, particularly in jurisdictions where such activity would be unlawful.
All content is of a general nature and may not address the specific circumstances of any individual or entity. It is not a substitute for professional advice or services. Any actions you take based on the information provided here are strictly at your own risk. You accept full responsibility for any decisions or outcomes arising from your use of this website and agree to release us from any liability in connection with your use of, or reliance upon, the content or products found herein.