
|
LBX Pharmacy Chain Joint Stock Company (603883.ss) Valoración de DCF |
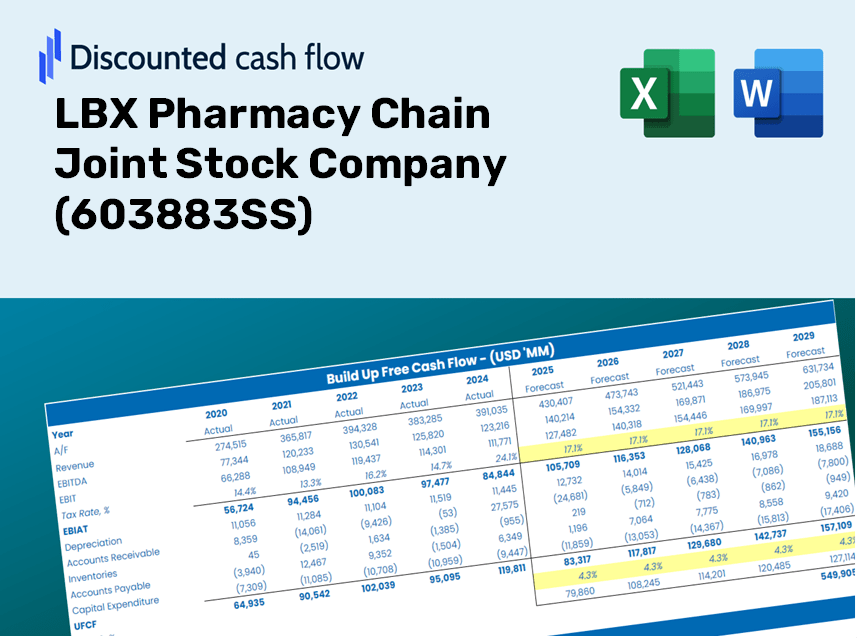
Completamente Editable: Adáptelo A Sus Necesidades En Excel O Sheets
Diseño Profesional: Plantillas Confiables Y Estándares De La Industria
Predeterminadas Para Un Uso Rápido Y Eficiente
Compatible con MAC / PC, completamente desbloqueado
No Se Necesita Experiencia; Fáciles De Seguir
LBX Pharmacy Chain Joint Stock Company (603883.SS) Bundle
Diseñada para la precisión, nuestra calculadora DCF (603883SS) le permite evaluar la valoración de la compañía de acciones conjuntas de la cadena de farmacia LBX utilizando datos financieros del mundo real, ofreciendo una flexibilidad completa para modificar todos los parámetros esenciales para mejorar las proyecciones.
Discounted Cash Flow (DCF) - (USD MM)
| Year | AY1 2020 |
AY2 2021 |
AY3 2022 |
AY4 2023 |
AY5 2024 |
FY1 2025 |
FY2 2026 |
FY3 2027 |
FY4 2028 |
FY5 2029 |
|---|---|---|---|---|---|---|---|---|---|---|
| Revenue | 13,966.7 | 15,695.7 | 20,175.5 | 22,437.5 | 22,357.6 | 23,005.3 | 23,671.8 | 24,357.6 | 25,063.3 | 25,789.4 |
| Revenue Growth, % | 0 | 12.38 | 28.54 | 11.21 | -0.35601 | 2.9 | 2.9 | 2.9 | 2.9 | 2.9 |
| EBITDA | 1,036.6 | 1,162.2 | 1,533.2 | 1,662.4 | 1,344.7 | 1,649.4 | 1,697.2 | 1,746.4 | 1,797.0 | 1,849.0 |
| EBITDA, % | 7.42 | 7.4 | 7.6 | 7.41 | 6.01 | 7.17 | 7.17 | 7.17 | 7.17 | 7.17 |
| Depreciation | 112.0 | 135.7 | 161.9 | 193.7 | 179.8 | 190.3 | 195.8 | 201.5 | 207.3 | 213.4 |
| Depreciation, % | 0.80207 | 0.8644 | 0.80231 | 0.86324 | 0.80439 | 0.82728 | 0.82728 | 0.82728 | 0.82728 | 0.82728 |
| EBIT | 924.6 | 1,026.5 | 1,371.3 | 1,468.7 | 1,164.8 | 1,459.1 | 1,501.4 | 1,544.9 | 1,589.6 | 1,635.7 |
| EBIT, % | 6.62 | 6.54 | 6.8 | 6.55 | 5.21 | 6.34 | 6.34 | 6.34 | 6.34 | 6.34 |
| Total Cash | 1,398.1 | 1,411.9 | 2,413.9 | 1,976.5 | 2,379.9 | 2,320.0 | 2,387.2 | 2,456.4 | 2,527.6 | 2,600.8 |
| Total Cash, percent | .0 | .0 | .0 | .0 | .0 | .0 | .0 | .0 | .0 | .0 |
| Account Receivables | 1,167.6 | .0 | .0 | 2,620.9 | 2,949.7 | 1,529.1 | 1,573.4 | 1,619.0 | 1,665.9 | 1,714.2 |
| Account Receivables, % | 8.36 | 0 | 0 | 11.68 | 13.19 | 6.65 | 6.65 | 6.65 | 6.65 | 6.65 |
| Inventories | 2,386.8 | 2,729.6 | 3,948.9 | 4,152.5 | 3,573.5 | 4,074.0 | 4,192.0 | 4,313.4 | 4,438.4 | 4,567.0 |
| Inventories, % | 17.09 | 17.39 | 19.57 | 18.51 | 15.98 | 17.71 | 17.71 | 17.71 | 17.71 | 17.71 |
| Accounts Payable | 1,534.2 | 1,769.2 | 2,367.2 | 6,995.0 | 2,009.0 | 3,411.7 | 3,510.6 | 3,612.3 | 3,716.9 | 3,824.6 |
| Accounts Payable, % | 10.98 | 11.27 | 11.73 | 31.18 | 8.99 | 14.83 | 14.83 | 14.83 | 14.83 | 14.83 |
| Capital Expenditure | -394.3 | -478.6 | -308.4 | -620.9 | -507.5 | -572.3 | -588.9 | -605.9 | -623.5 | -641.5 |
| Capital Expenditure, % | -2.82 | -3.05 | -1.53 | -2.77 | -2.27 | -2.49 | -2.49 | -2.49 | -2.49 | -2.49 |
| Tax Rate, % | 43.33 | 43.33 | 43.33 | 43.33 | 43.33 | 43.33 | 43.33 | 43.33 | 43.33 | 43.33 |
| EBITAT | 600.1 | 714.1 | 891.3 | 969.2 | 660.1 | 940.1 | 967.3 | 995.3 | 1,024.2 | 1,053.8 |
| Depreciation | ||||||||||
| Changes in Account Receivables | ||||||||||
| Changes in Inventories | ||||||||||
| Changes in Accounts Payable | ||||||||||
| Capital Expenditure | ||||||||||
| UFCF | -1,702.4 | 1,431.1 | 123.4 | 2,345.4 | -4,403.5 | 2,881.0 | 510.8 | 525.6 | 540.8 | 556.5 |
| WACC, % | 4.86 | 4.94 | 4.86 | 4.88 | 4.72 | 4.85 | 4.85 | 4.85 | 4.85 | 4.85 |
| PV UFCF | ||||||||||
| SUM PV UFCF | 4,554.9 | |||||||||
| Long Term Growth Rate, % | 3.50 | |||||||||
| Free cash flow (T + 1) | 576 | |||||||||
| Terminal Value | 42,615 | |||||||||
| Present Terminal Value | 33,627 | |||||||||
| Enterprise Value | 38,182 | |||||||||
| Net Debt | 7,963 | |||||||||
| Equity Value | 30,219 | |||||||||
| Diluted Shares Outstanding, MM | 763 | |||||||||
| Equity Value Per Share | 39.59 |
What You Will Receive
- Genuine LBX Financial Data: Pre-loaded with LBX Pharmacy Chain’s historical and forecasted data for accurate analysis.
- Customizable Template: Easily adjust critical inputs such as revenue growth, WACC, and EBITDA percentages.
- Instant Calculations: Watch LBX’s intrinsic value update in real-time as you make adjustments.
- Professional Valuation Tool: Tailored for investors, analysts, and consultants aiming for precise DCF outcomes.
- Intuitive Design: Clear layout and straightforward instructions suitable for all skill levels.
Key Features
- Comprehensive Historical Data: Access LBX Pharmacy Chain's (603883SS) past financial statements along with pre-filled forecasts.
- Completely Customizable Inputs: Modify parameters such as WACC, tax rates, revenue growth, and EBITDA margins.
- Real-Time Results: Monitor the intrinsic value of LBX Pharmacy Chain (603883SS) as it updates instantly.
- Intuitive Visual Outputs: Engaging dashboard charts present valuation results and essential metrics clearly.
- Designed for Precision: A professional-grade tool tailored for analysts, investors, and finance professionals.
How It Works
- Step 1: Download the prebuilt Excel template featuring LBX Pharmacy Chain Joint Stock Company (603883SS) data.
- Step 2: Examine the populated sheets to grasp essential metrics.
- Step 3: Modify forecasts and assumptions in the editable yellow cells (WACC, growth, margins).
- Step 4: Instantly see updated results, including the intrinsic value of LBX Pharmacy Chain Joint Stock Company (603883SS).
- Step 5: Make well-informed investment choices or create reports based on the output.
Why Opt for LBX Pharmacy Chain Calculator?
- Time Efficient: Skip the hassle of building a DCF model from the ground up – it’s all set for you.
- Enhanced Precision: Trustworthy financial data and formulas minimize valuation errors.
- Fully Adaptable: Customize the model to align with your specific assumptions and forecasts.
- User-Friendly: Intuitive charts and outputs simplify the analysis of results.
- Endorsed by Professionals: Created for experts who prioritize accuracy and practicality.
Who Can Benefit from LBX Pharmacy Chain Joint Stock Company (603883SS)?
- Healthcare Investors: Develop comprehensive and trustworthy valuation models for assessing pharmacy investments.
- Pharmaceutical Finance Teams: Evaluate valuation scenarios to inform corporate strategy and decision-making.
- Consultants and Advisors: Deliver precise valuation analyses and insights related to LBX Pharmacy Chain stock.
- Students and Educators: Utilize real market data to practice and teach financial modeling in the healthcare sector.
- Business Enthusiasts: Gain insights into how pharmacy chains like LBX are valued within the industry.
Contents of the Template
- Pre-Filled Data: Features historical financials and forecasts for LBX Pharmacy Chain Joint Stock Company (603883SS).
- Discounted Cash Flow Model: An editable DCF valuation model with automatic calculations for precise analysis.
- Weighted Average Cost of Capital (WACC): A dedicated worksheet for determining WACC based on customized inputs.
- Key Financial Ratios: Evaluate LBX Pharmacy's profitability, efficiency, and leverage indicators.
- Customizable Inputs: Easily adjust revenue growth, margins, and tax rates to fit your analysis.
- Clear Dashboard: Visual charts and tables summarizing essential valuation outcomes.
Disclaimer
All information, articles, and product details provided on this website are for general informational and educational purposes only. We do not claim any ownership over, nor do we intend to infringe upon, any trademarks, copyrights, logos, brand names, or other intellectual property mentioned or depicted on this site. Such intellectual property remains the property of its respective owners, and any references here are made solely for identification or informational purposes, without implying any affiliation, endorsement, or partnership.
We make no representations or warranties, express or implied, regarding the accuracy, completeness, or suitability of any content or products presented. Nothing on this website should be construed as legal, tax, investment, financial, medical, or other professional advice. In addition, no part of this site—including articles or product references—constitutes a solicitation, recommendation, endorsement, advertisement, or offer to buy or sell any securities, franchises, or other financial instruments, particularly in jurisdictions where such activity would be unlawful.
All content is of a general nature and may not address the specific circumstances of any individual or entity. It is not a substitute for professional advice or services. Any actions you take based on the information provided here are strictly at your own risk. You accept full responsibility for any decisions or outcomes arising from your use of this website and agree to release us from any liability in connection with your use of, or reliance upon, the content or products found herein.